Discover our other sites

Statistics and Probability Worksheets

Free statistics and probability worksheets: mean, median, mode, box plots, histograms, dot plots, mean absolute deviation, probability, sampling, scatter plots and two-way tables. Every worksheet has an answer key.

Mean, Median, Mode & Data Displays (6th Grade)

6 printable worksheets: Mean Median Mode and Range A, Mean Median Mode and Range B, Dot Plots, Five-Number Summary and Box Plots, Reading Histograms and Mean Absolute Deviation. The answer key is on page 2 of every PDF.

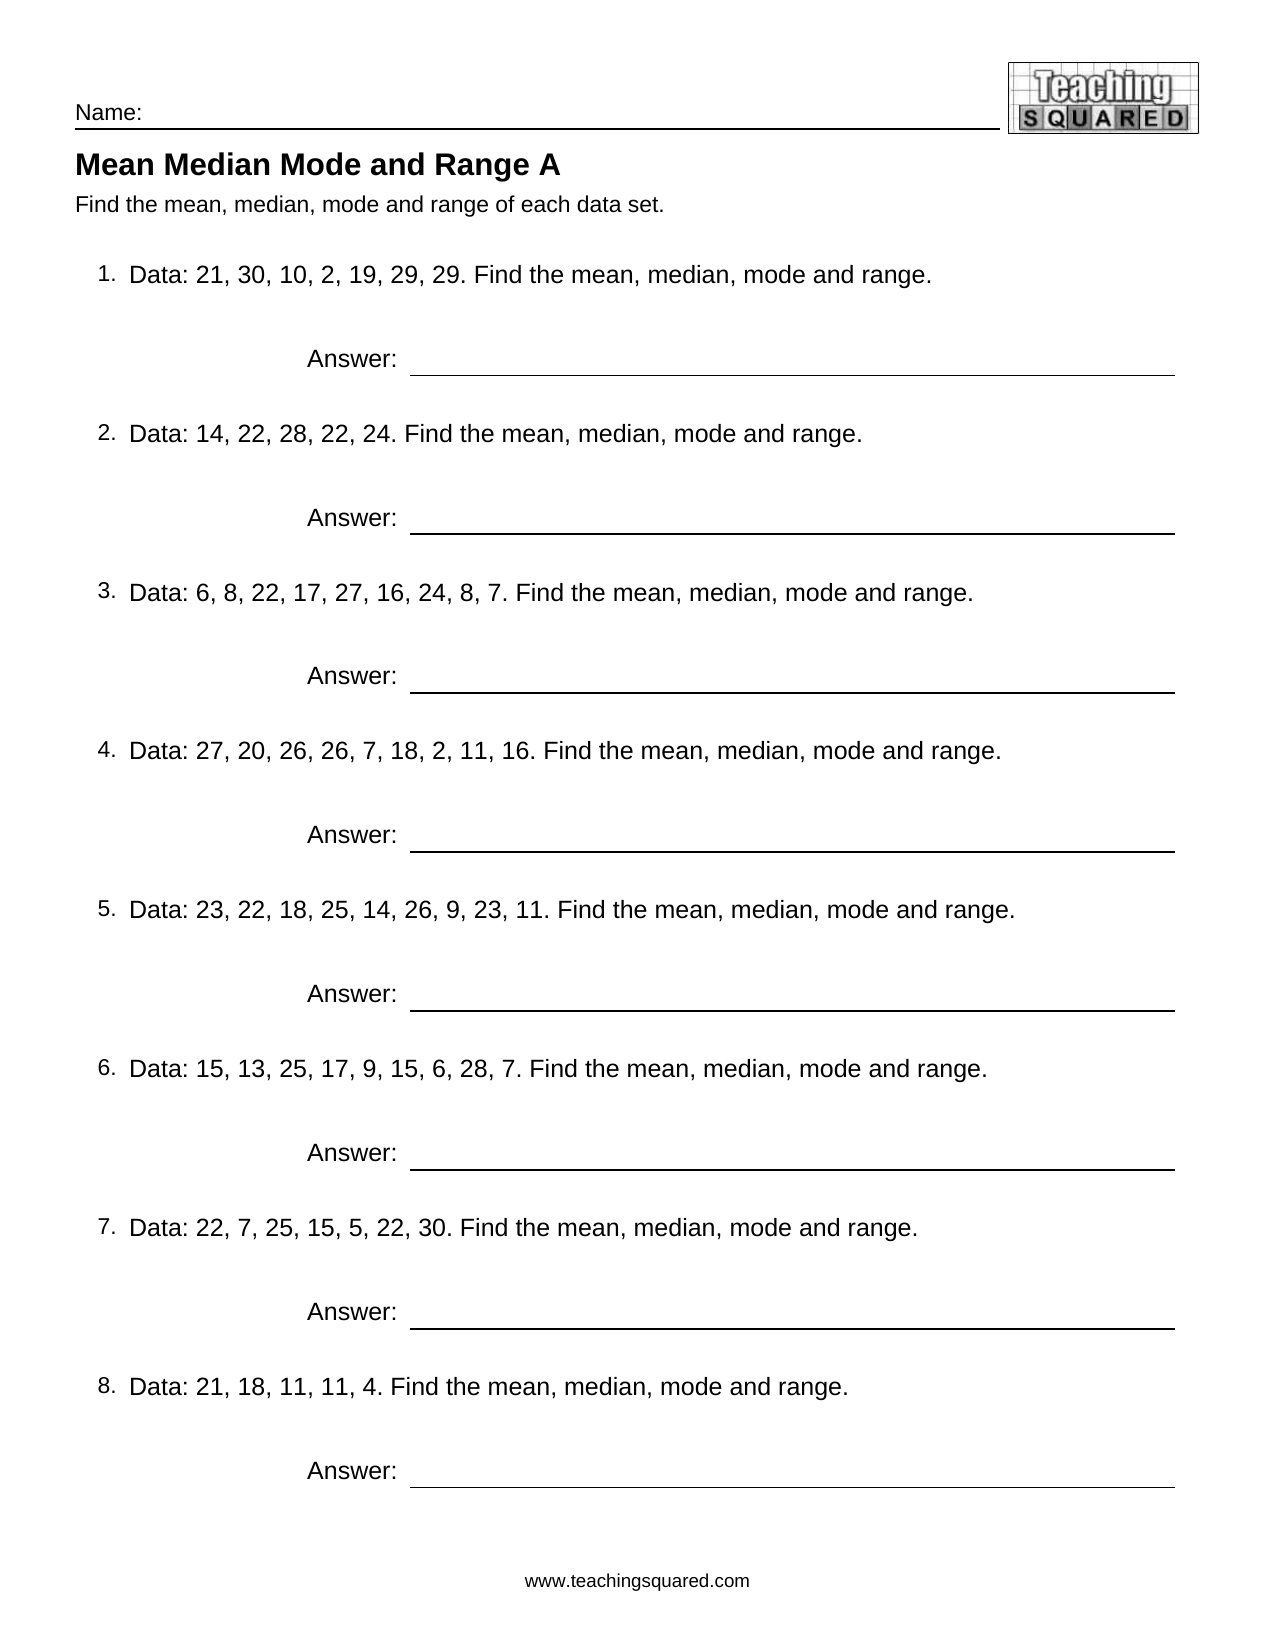
Mean Median Mode and Range A worksheet
Mean Median Mode and Range A
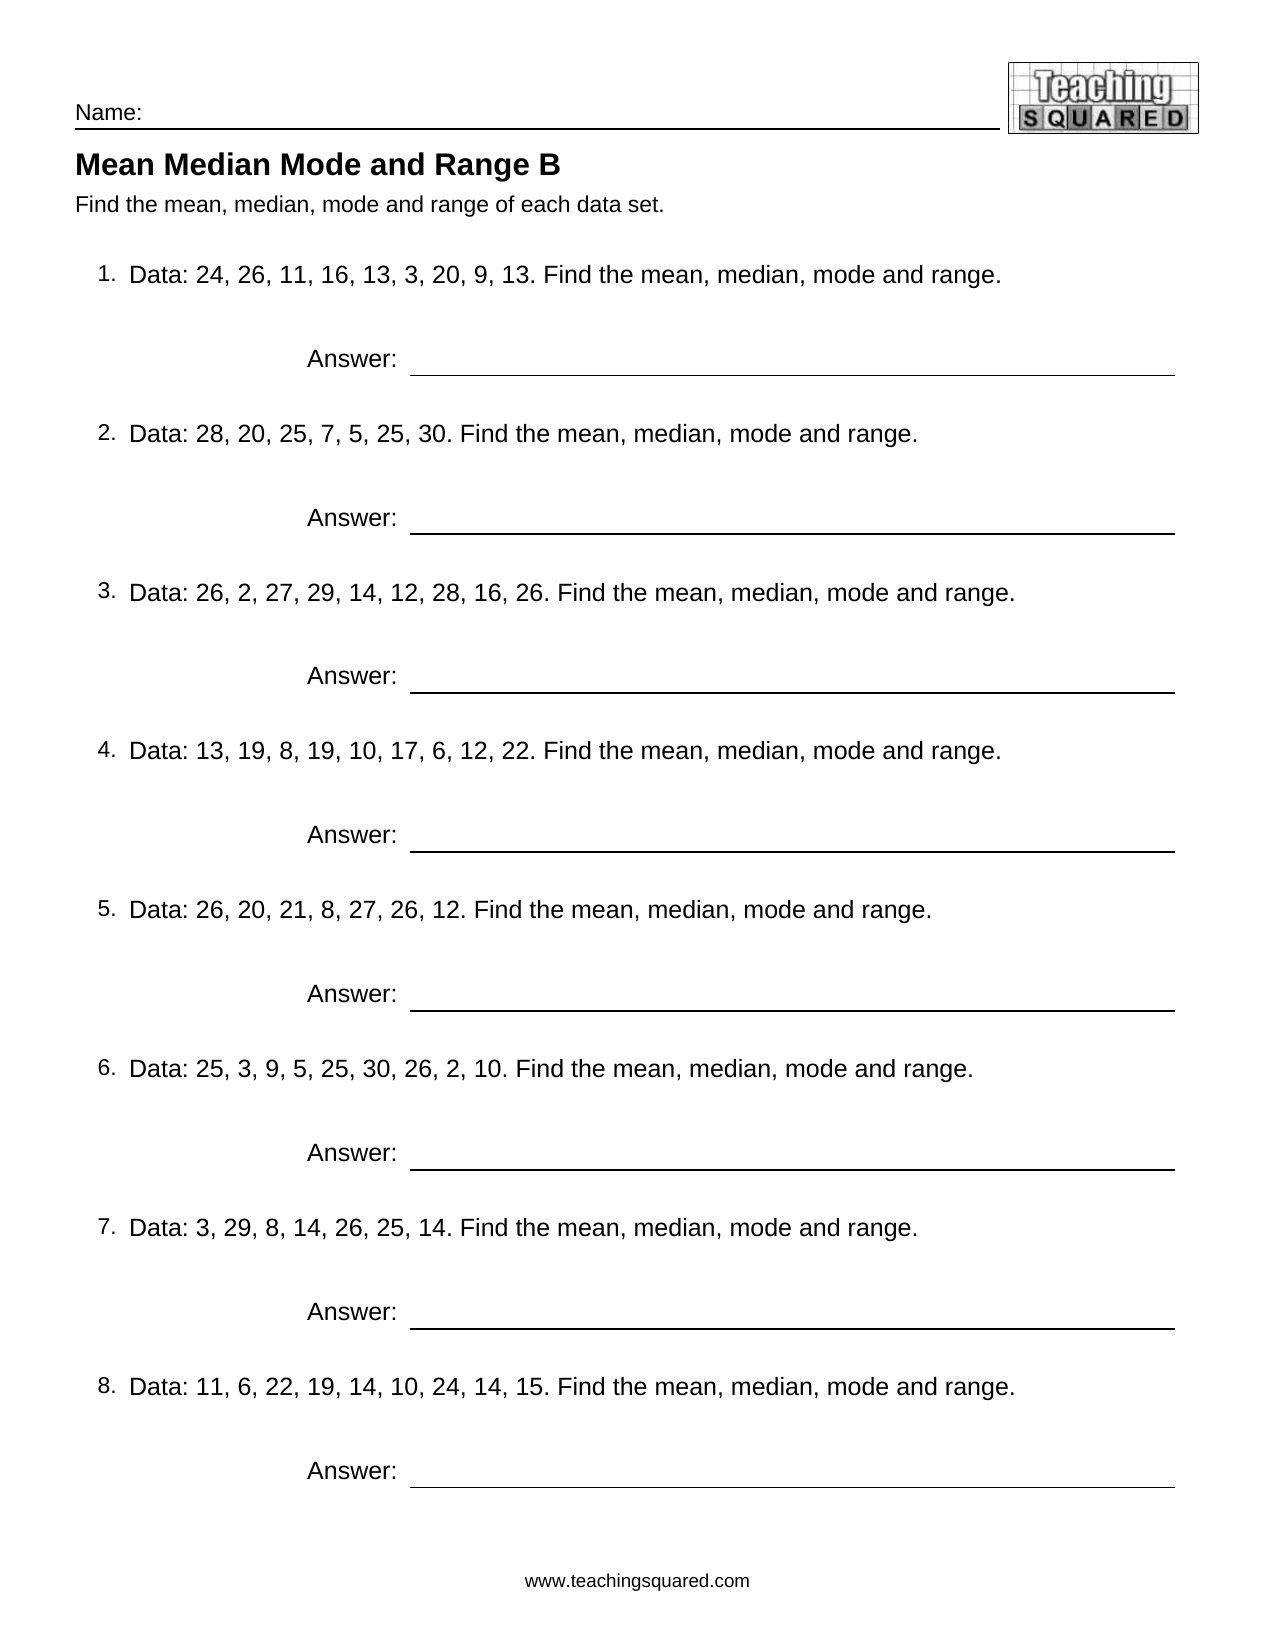
Mean Median Mode and Range B worksheet
Mean Median Mode and Range B
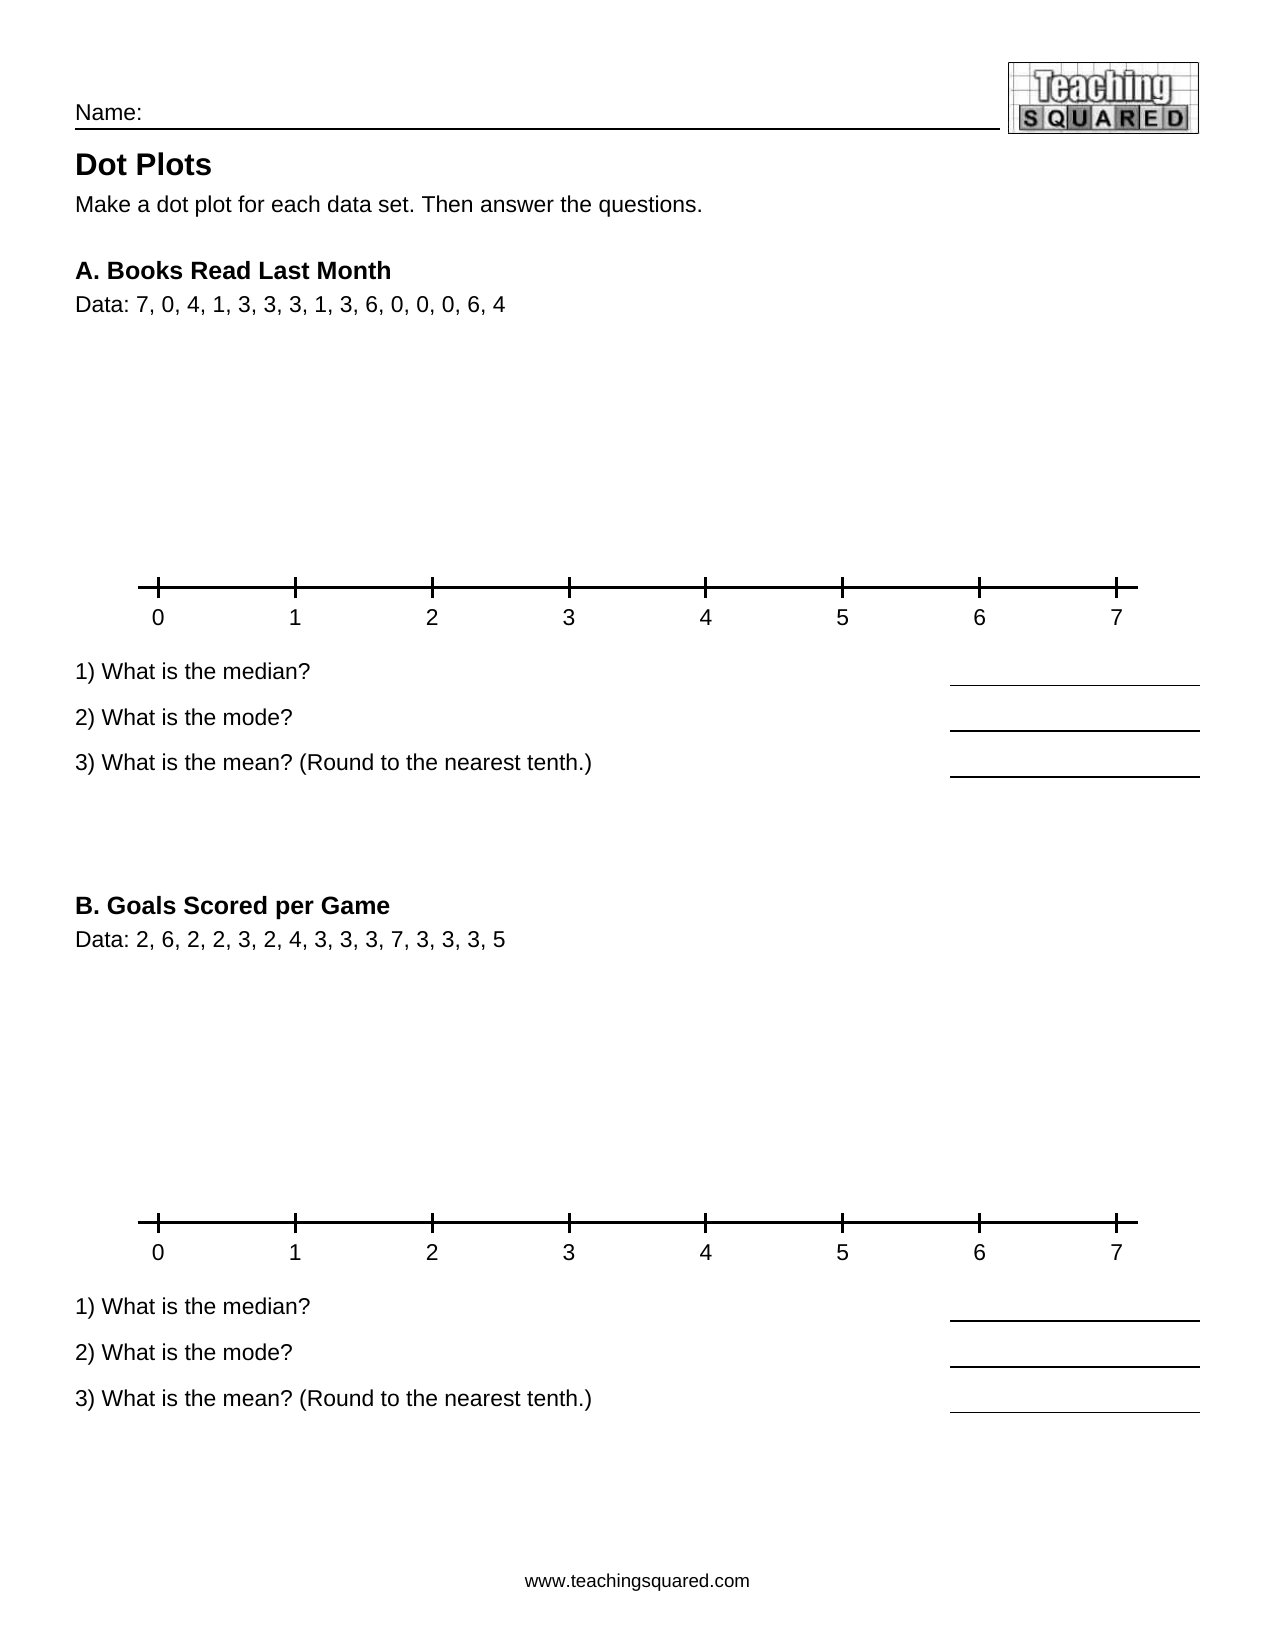
Dot Plots worksheet
Dot Plots
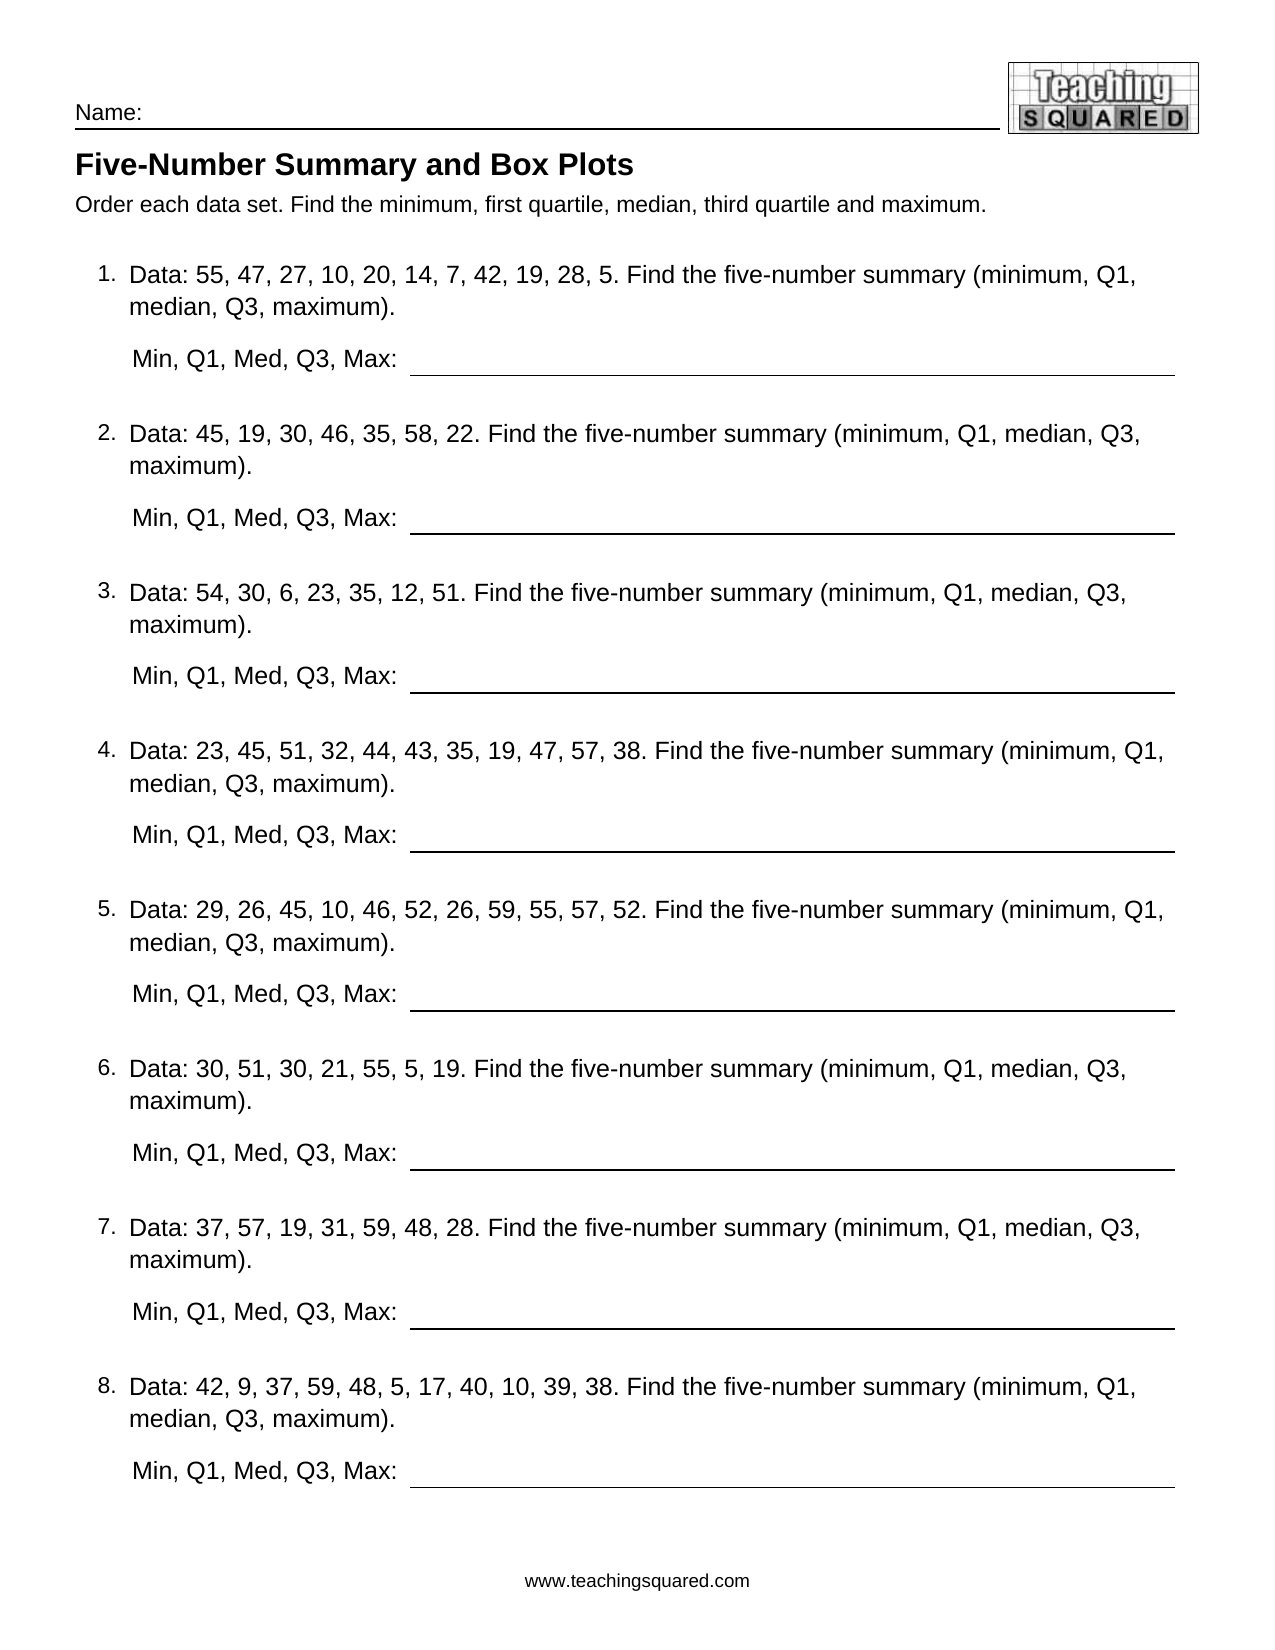
Five-Number Summary and Box Plots worksheet
Five-Number Summary and Box Plots
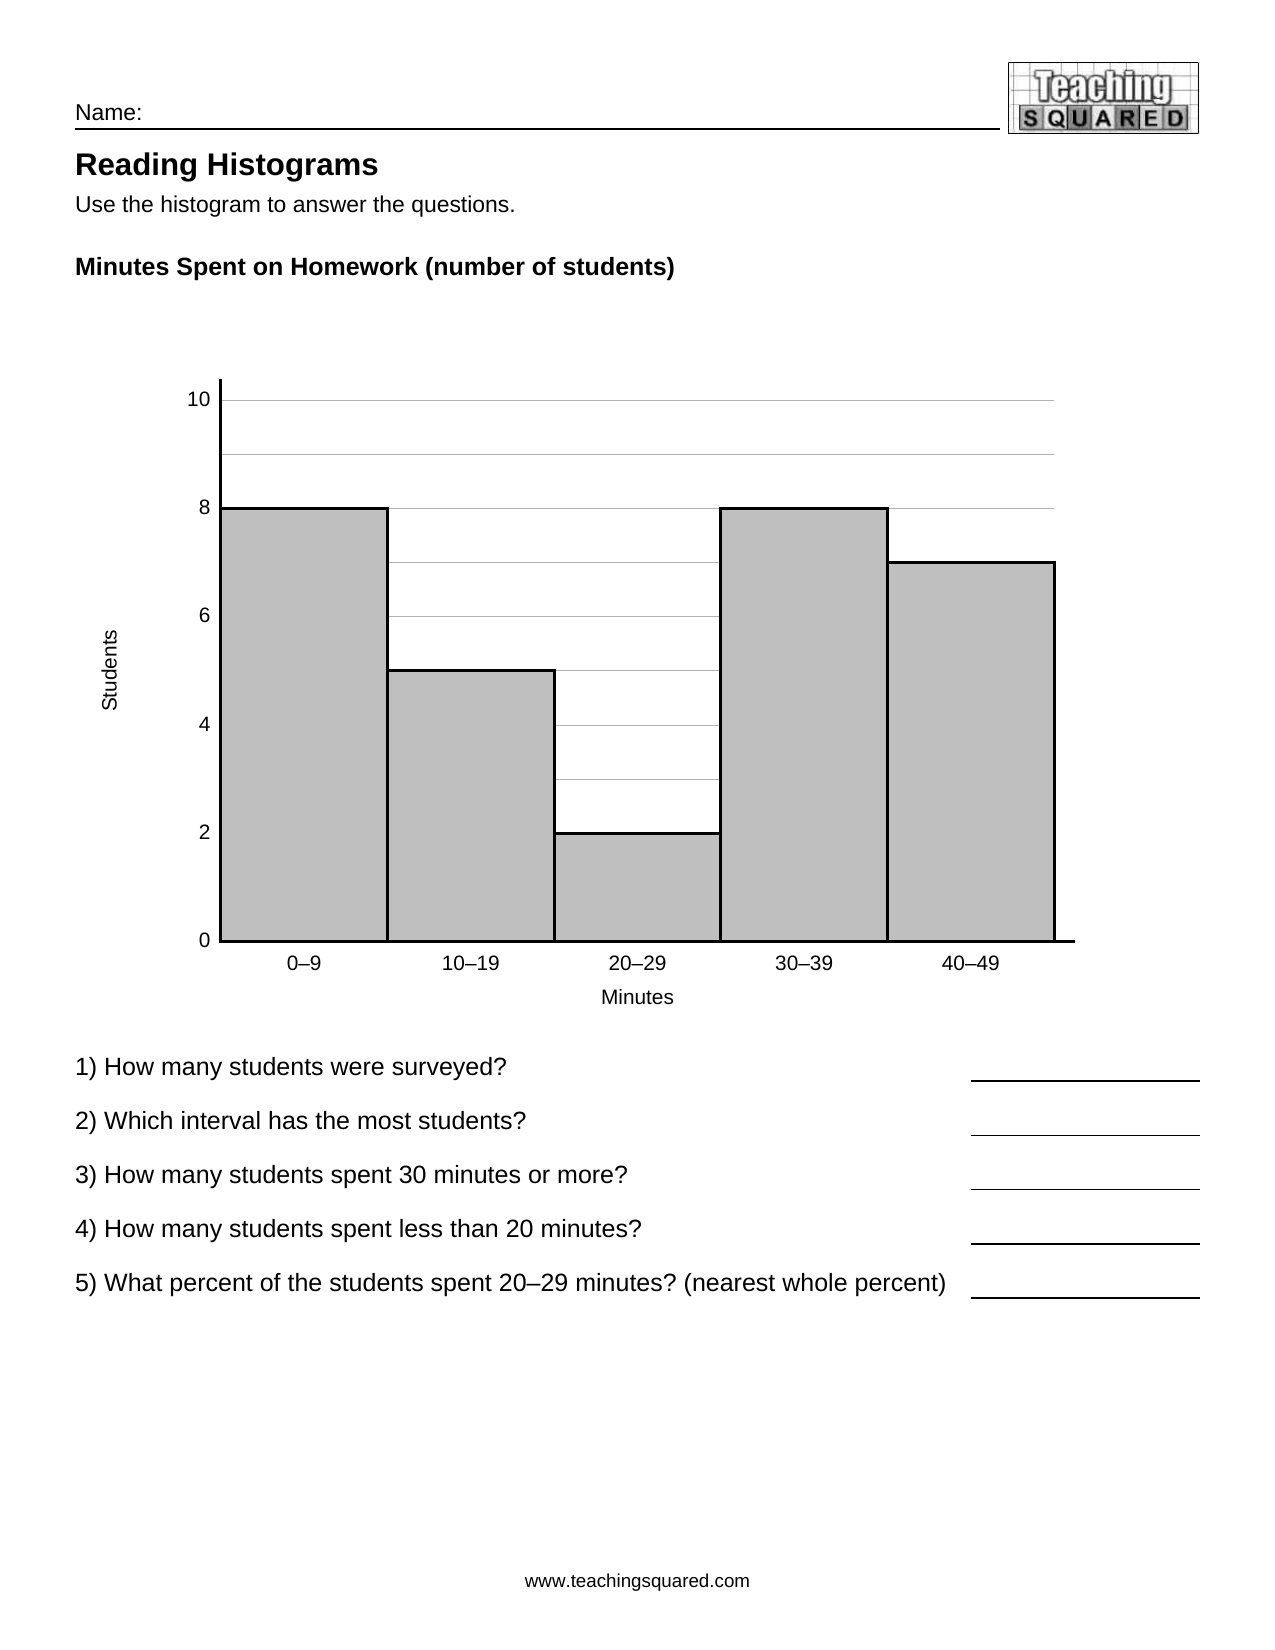
Reading Histograms worksheet
Reading Histograms
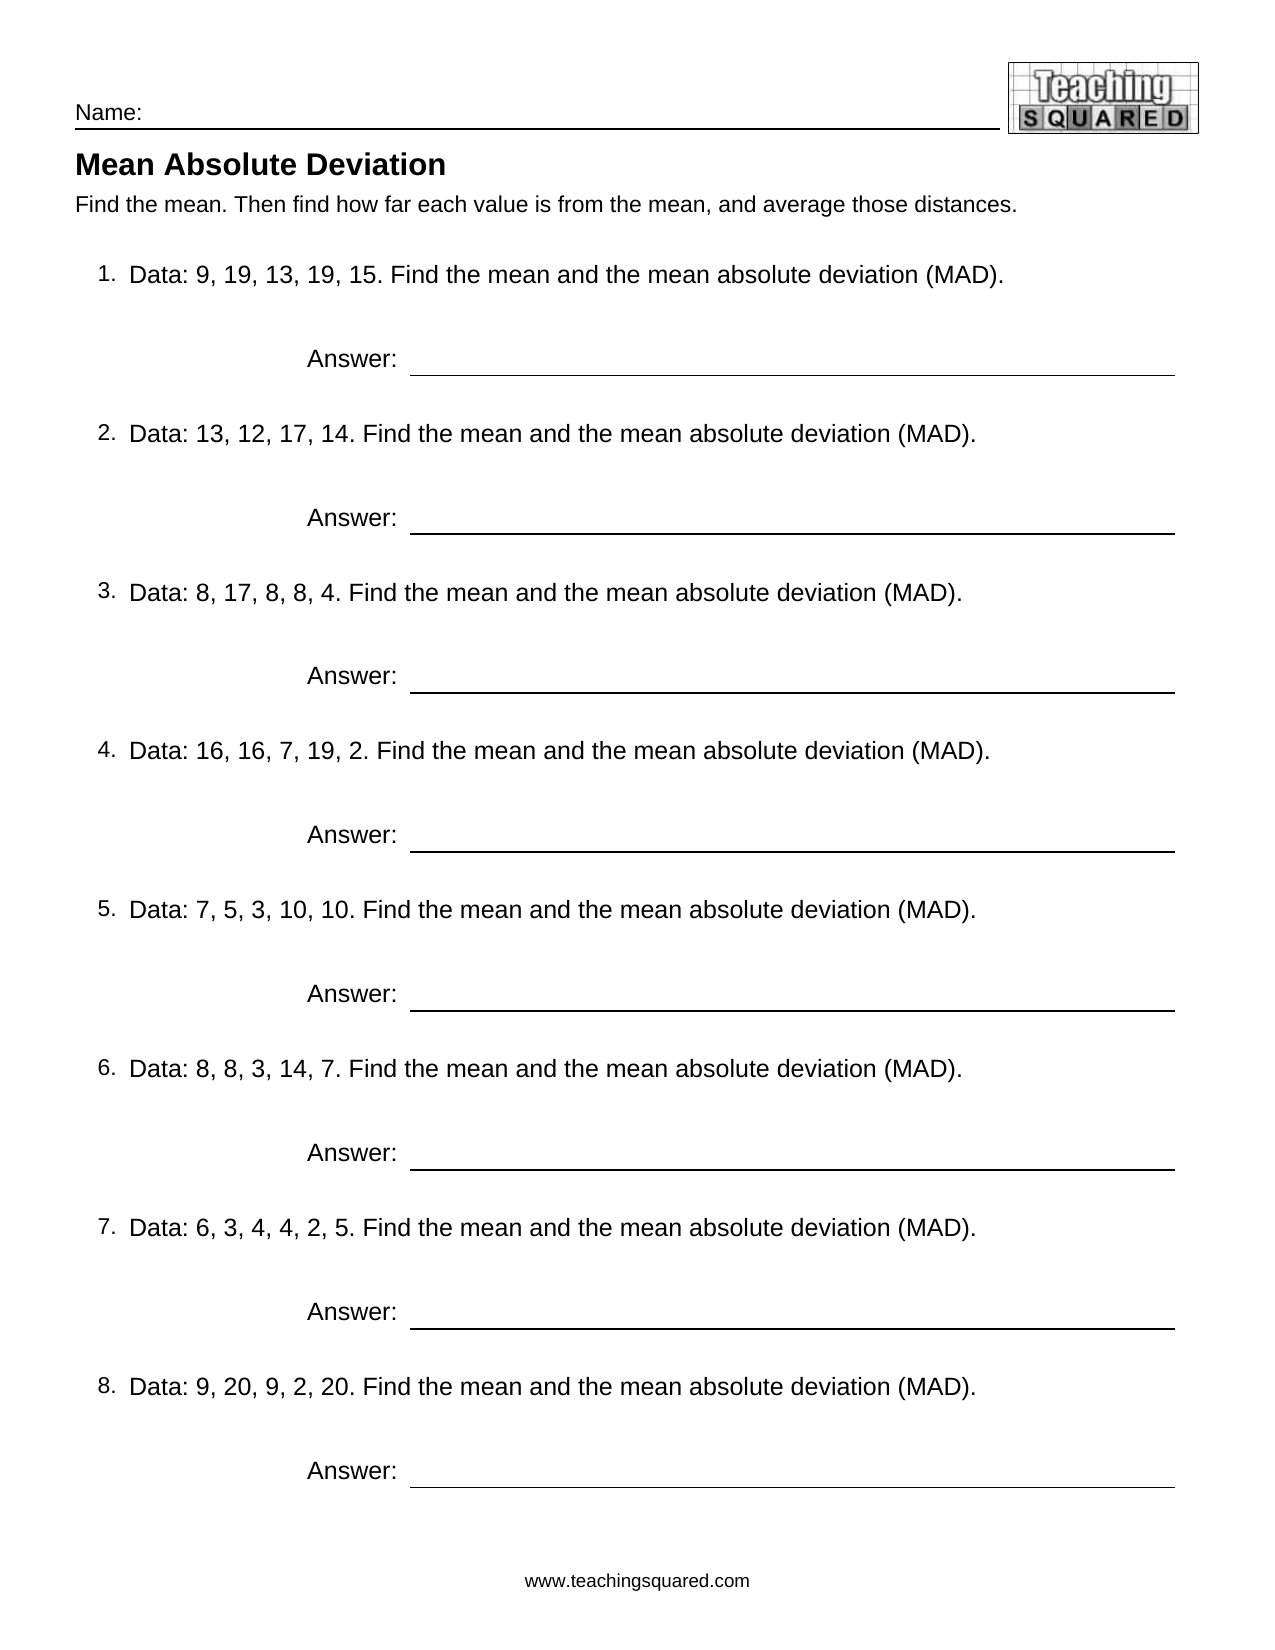
Mean Absolute Deviation worksheet
Mean Absolute Deviation

Probability (7th Grade)

6 printable worksheets: Simple Probability, Probability with Number Cubes and Marbles, Experimental Probability and Predictions, Sample Spaces and Compound Events, Probability of Independent Events and Probability Review. The answer key is on page 2 of every PDF.

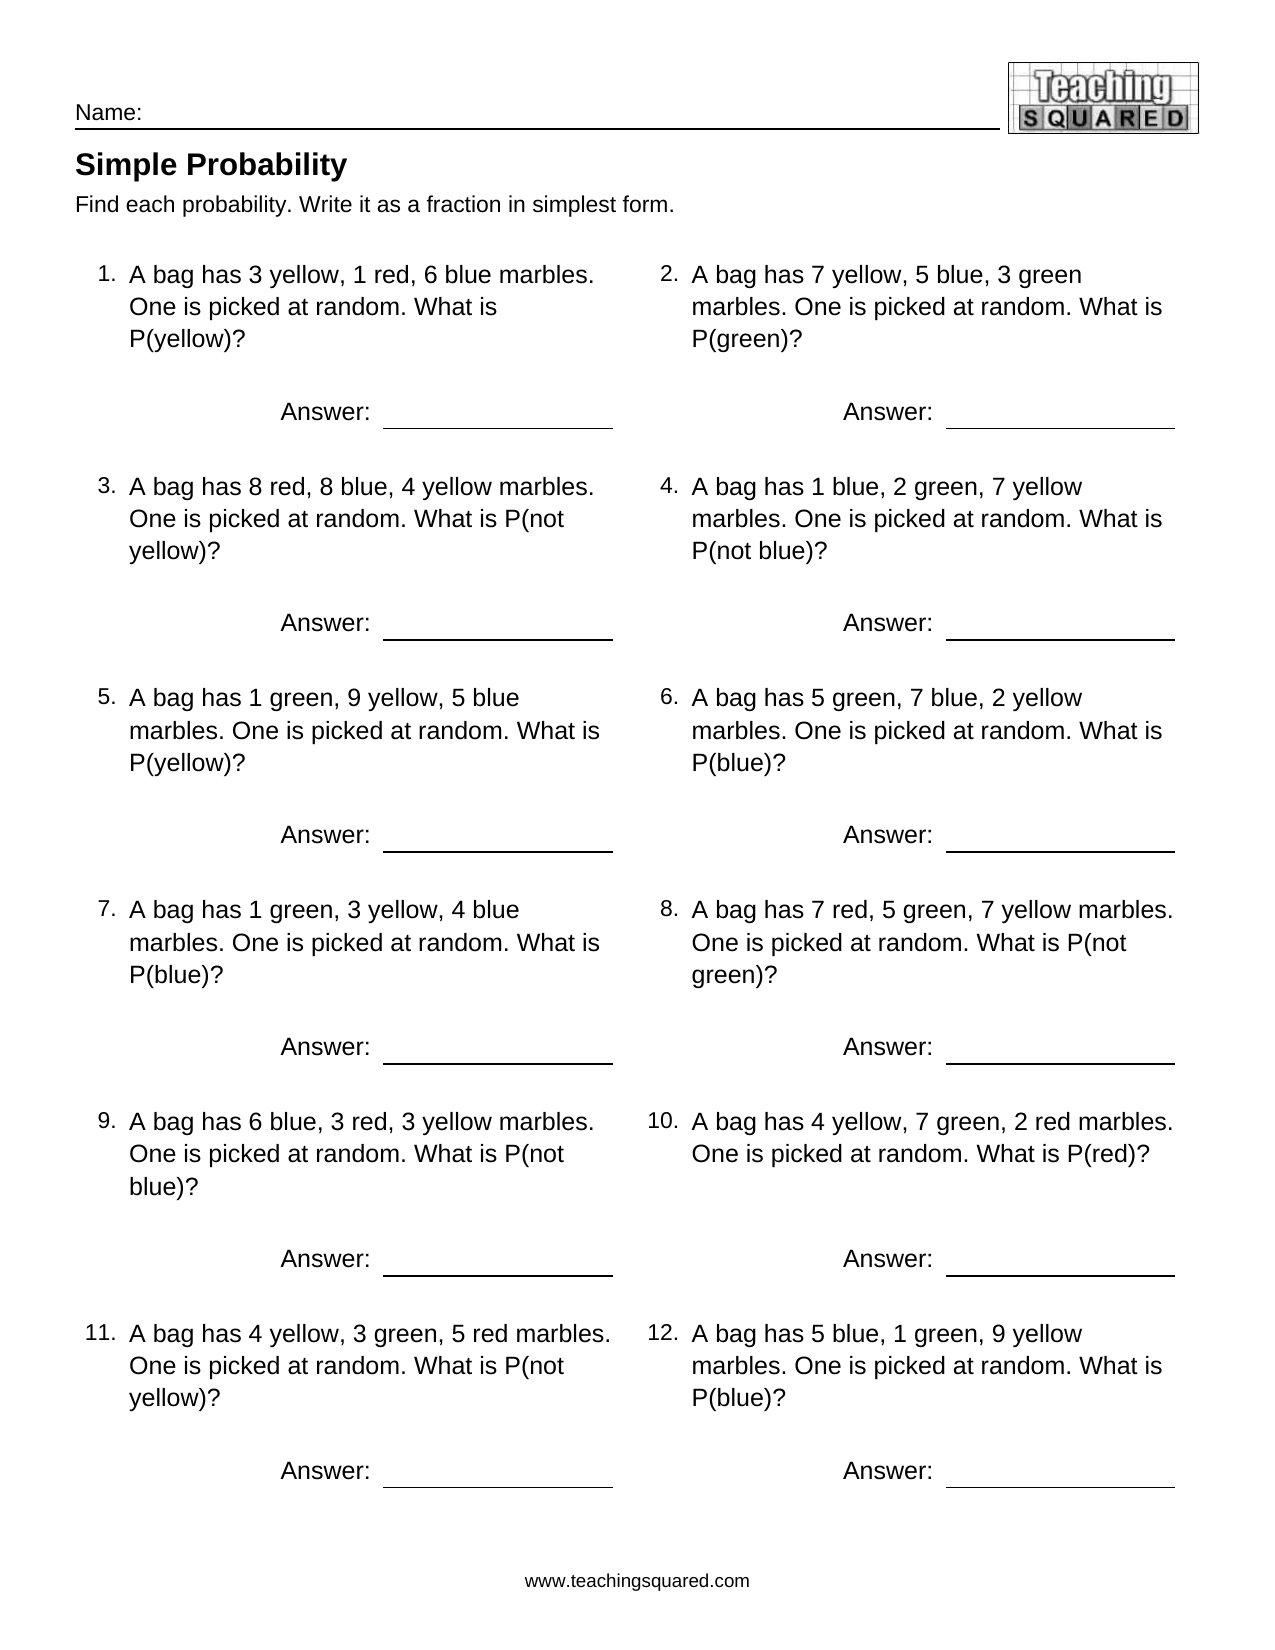
Simple Probability worksheet
Simple Probability
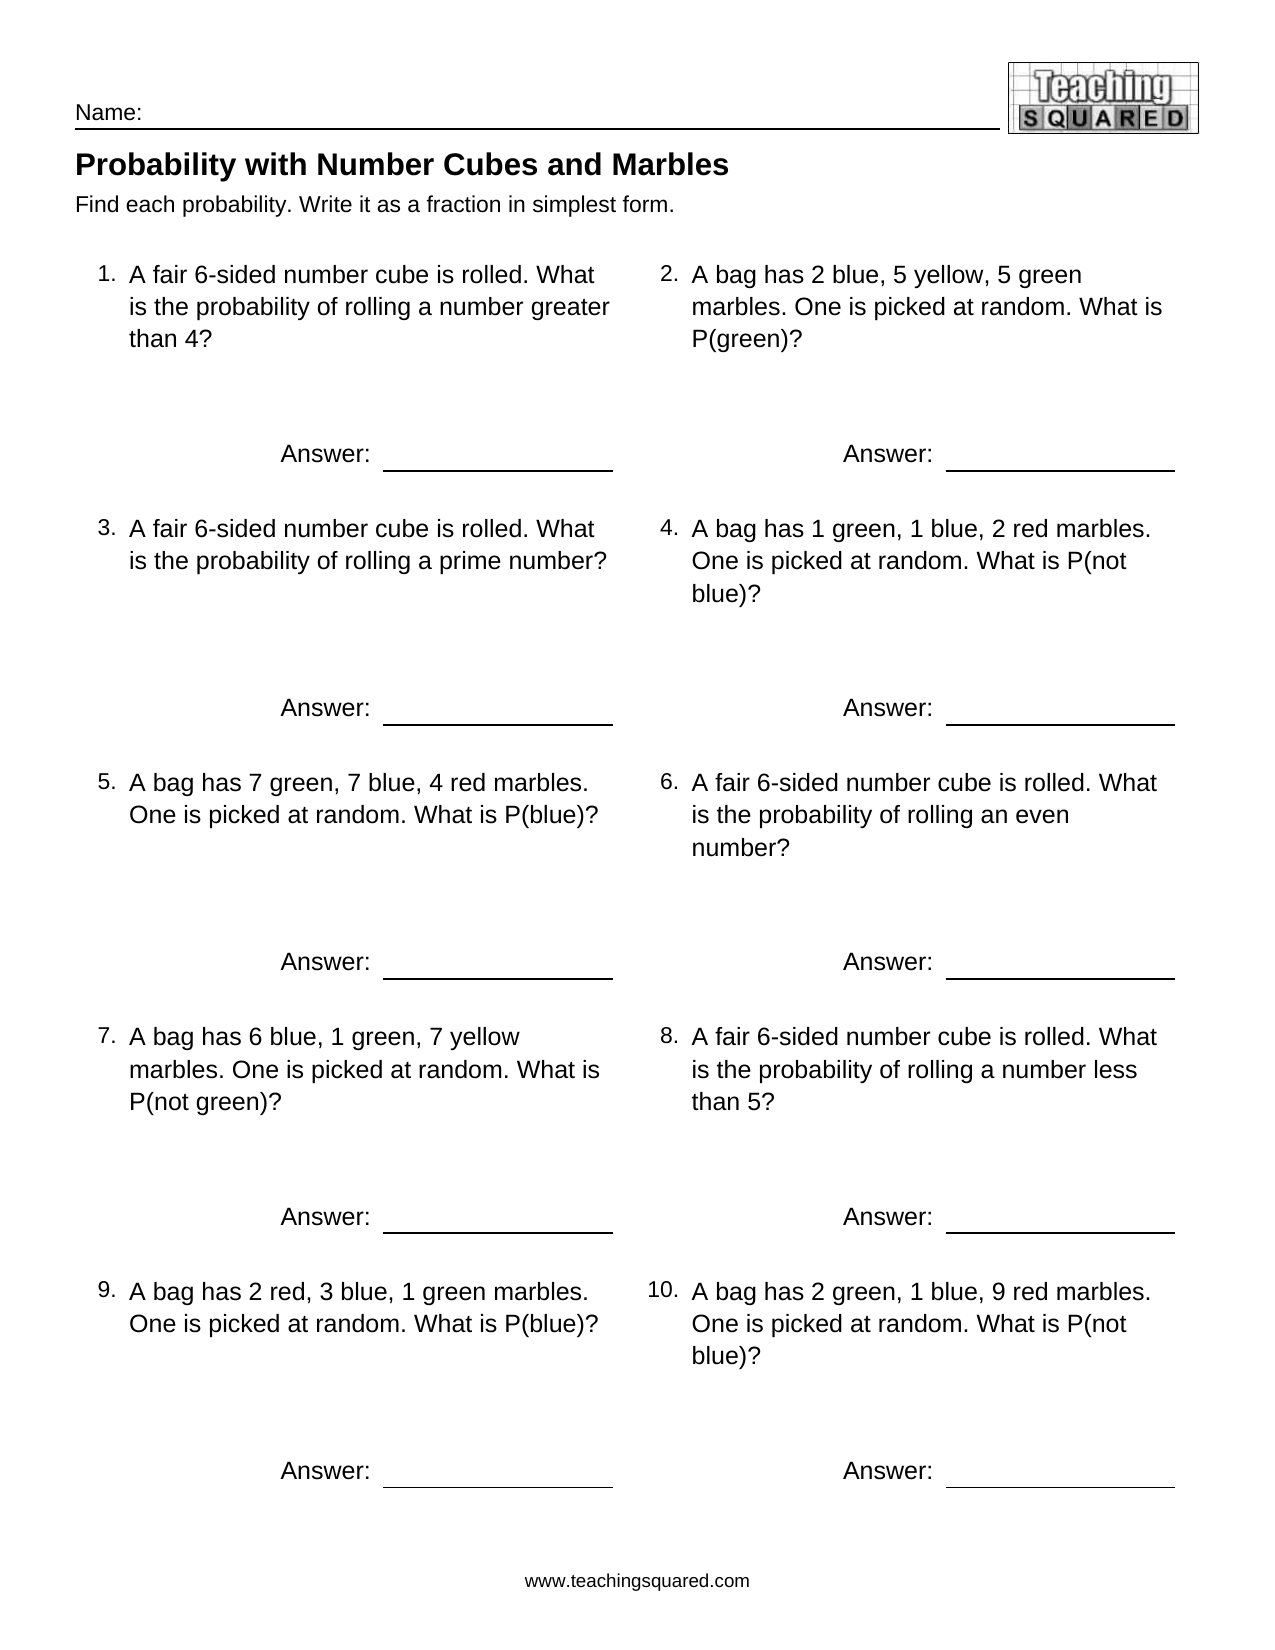
Probability with Number Cubes and Marbles worksheet
Probability with Number Cubes and Marbles
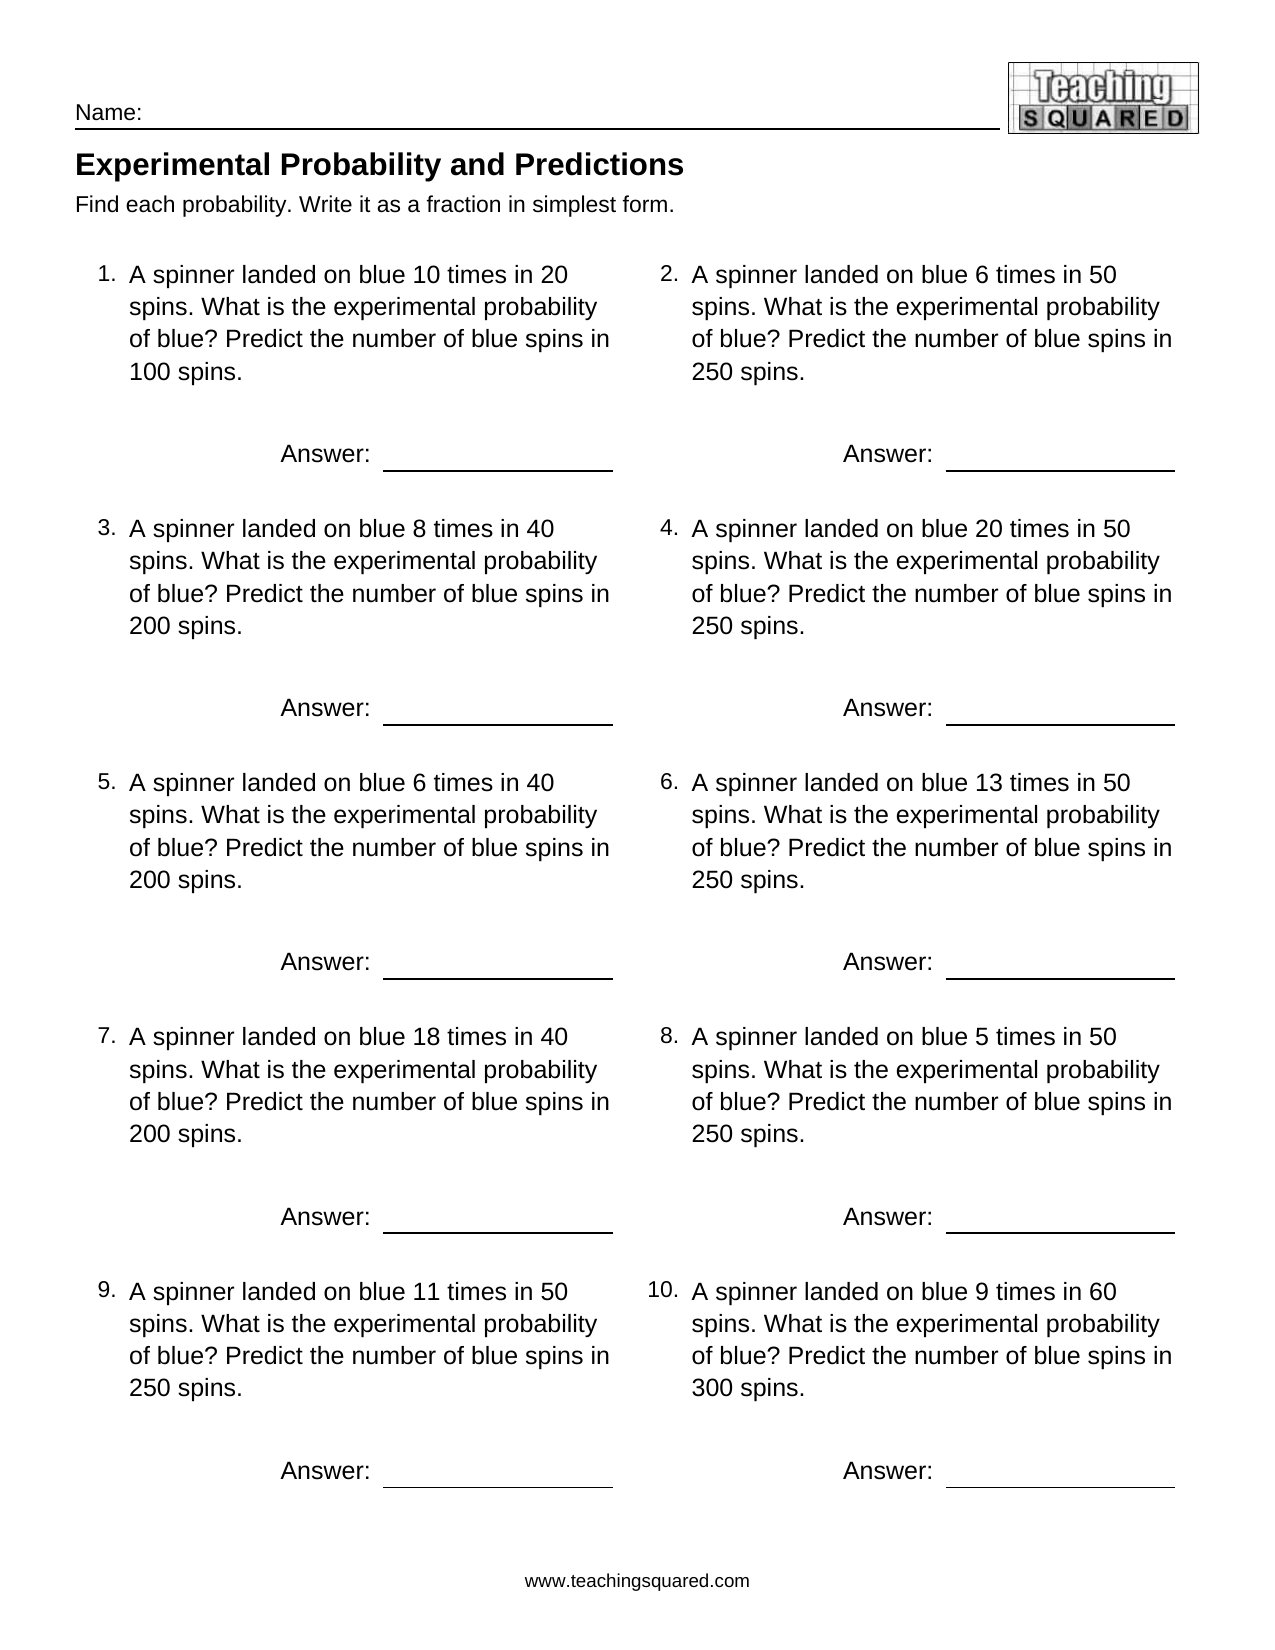
Experimental Probability and Predictions worksheet
Experimental Probability and Predictions
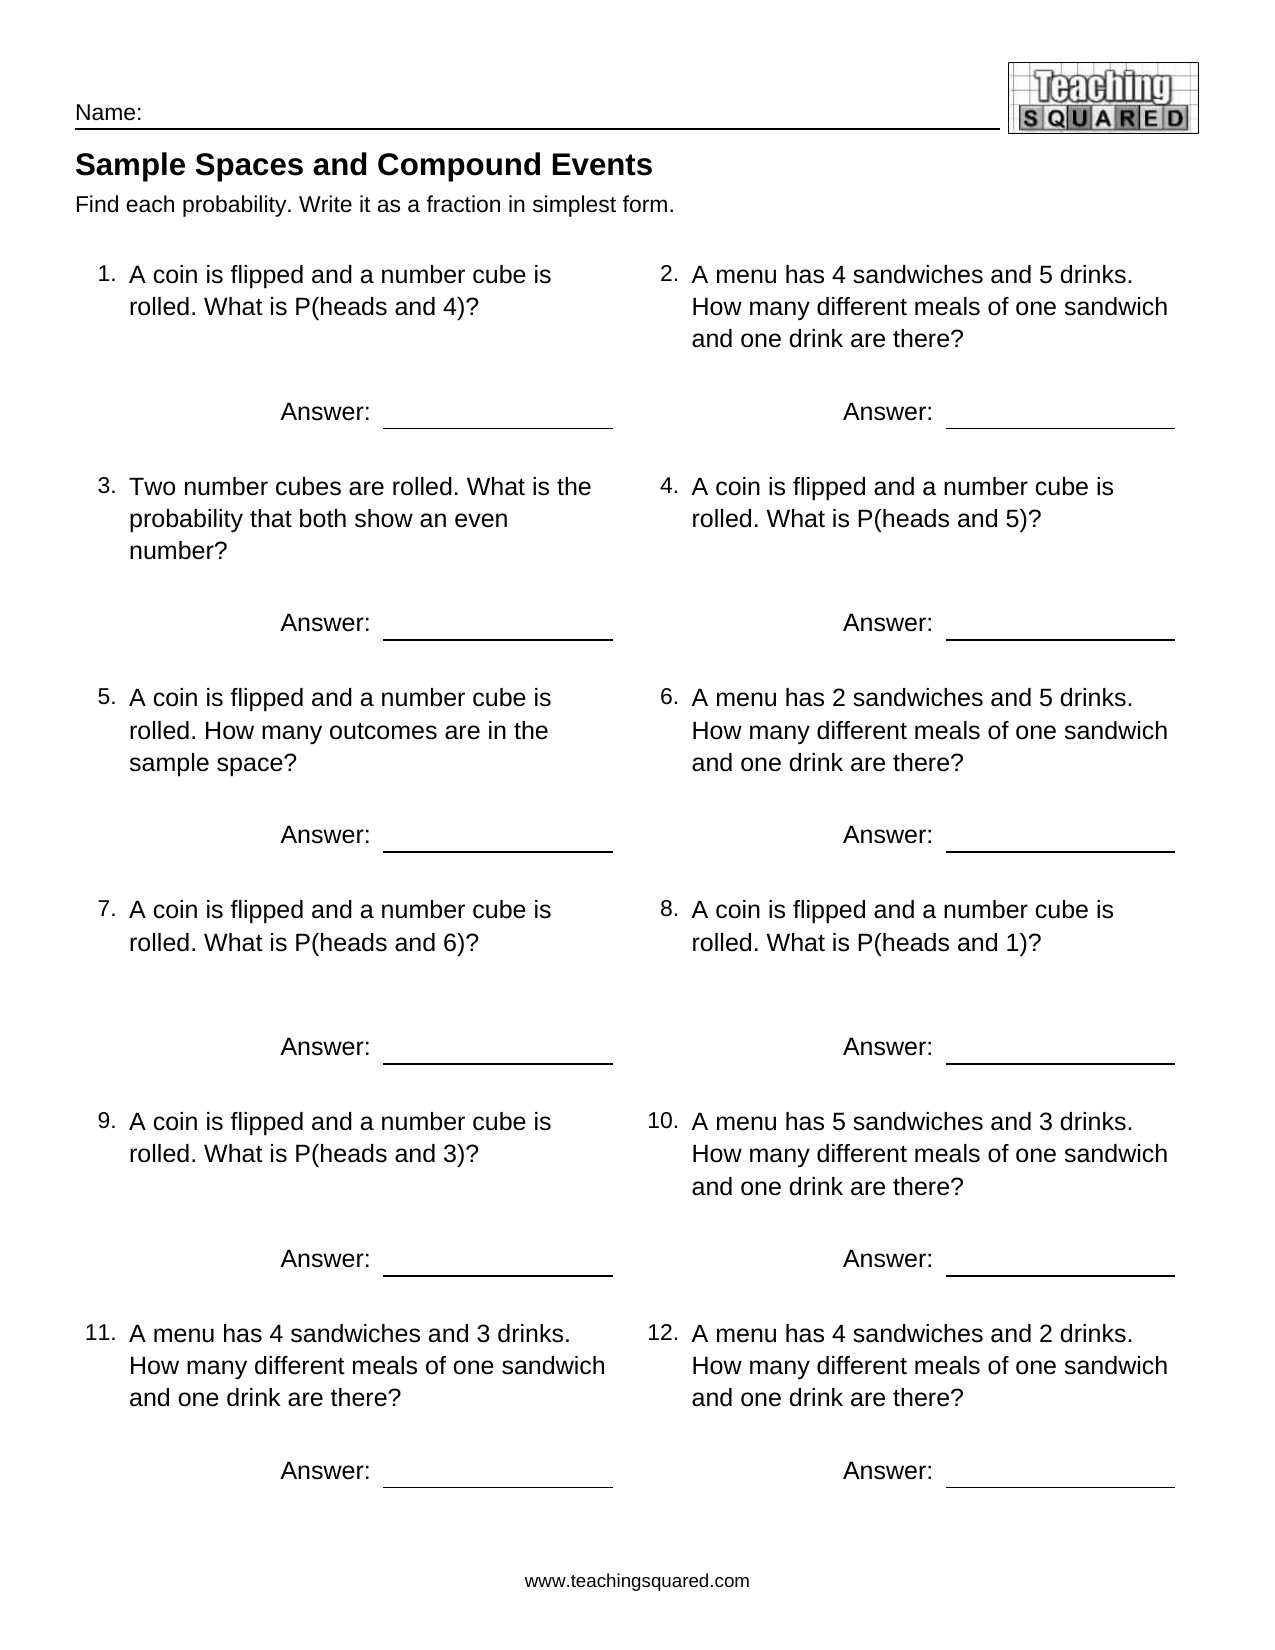
Sample Spaces and Compound Events worksheet
Sample Spaces and Compound Events
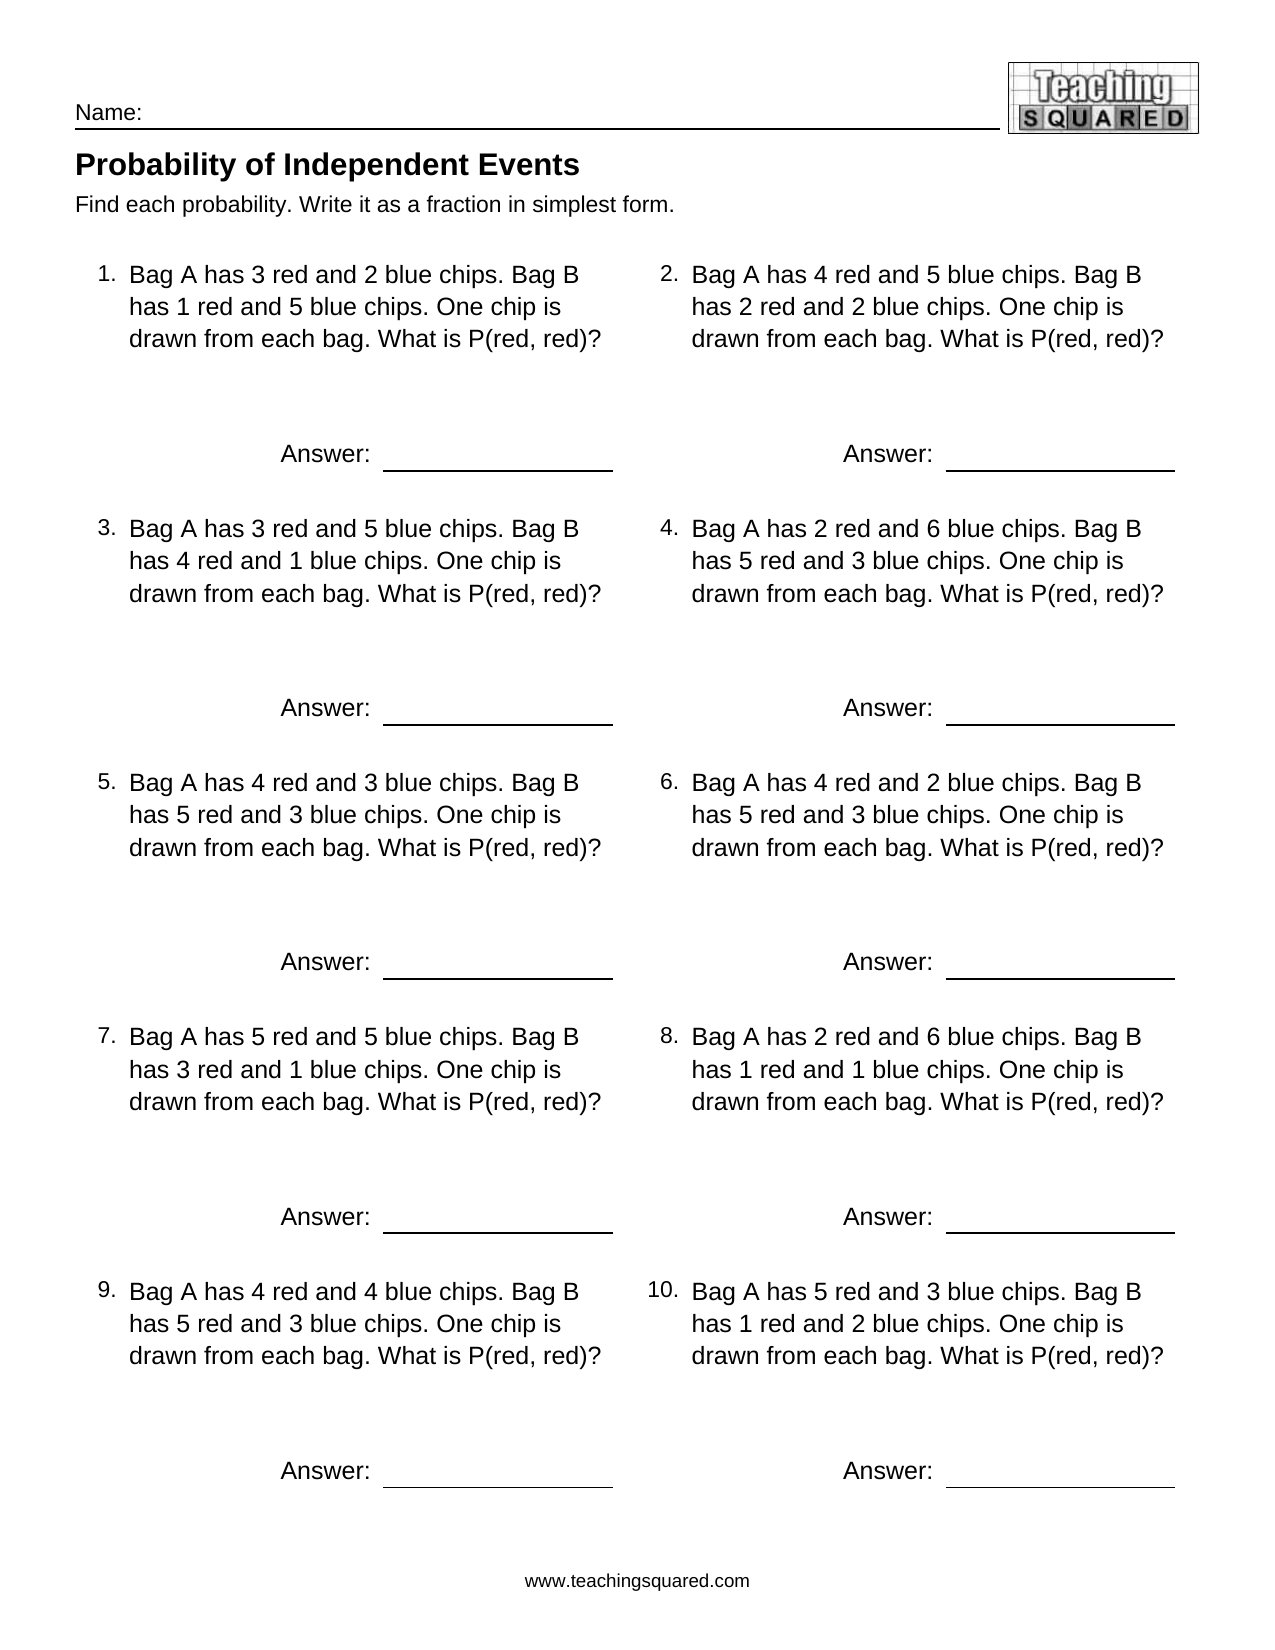
Probability of Independent Events worksheet
Probability of Independent Events
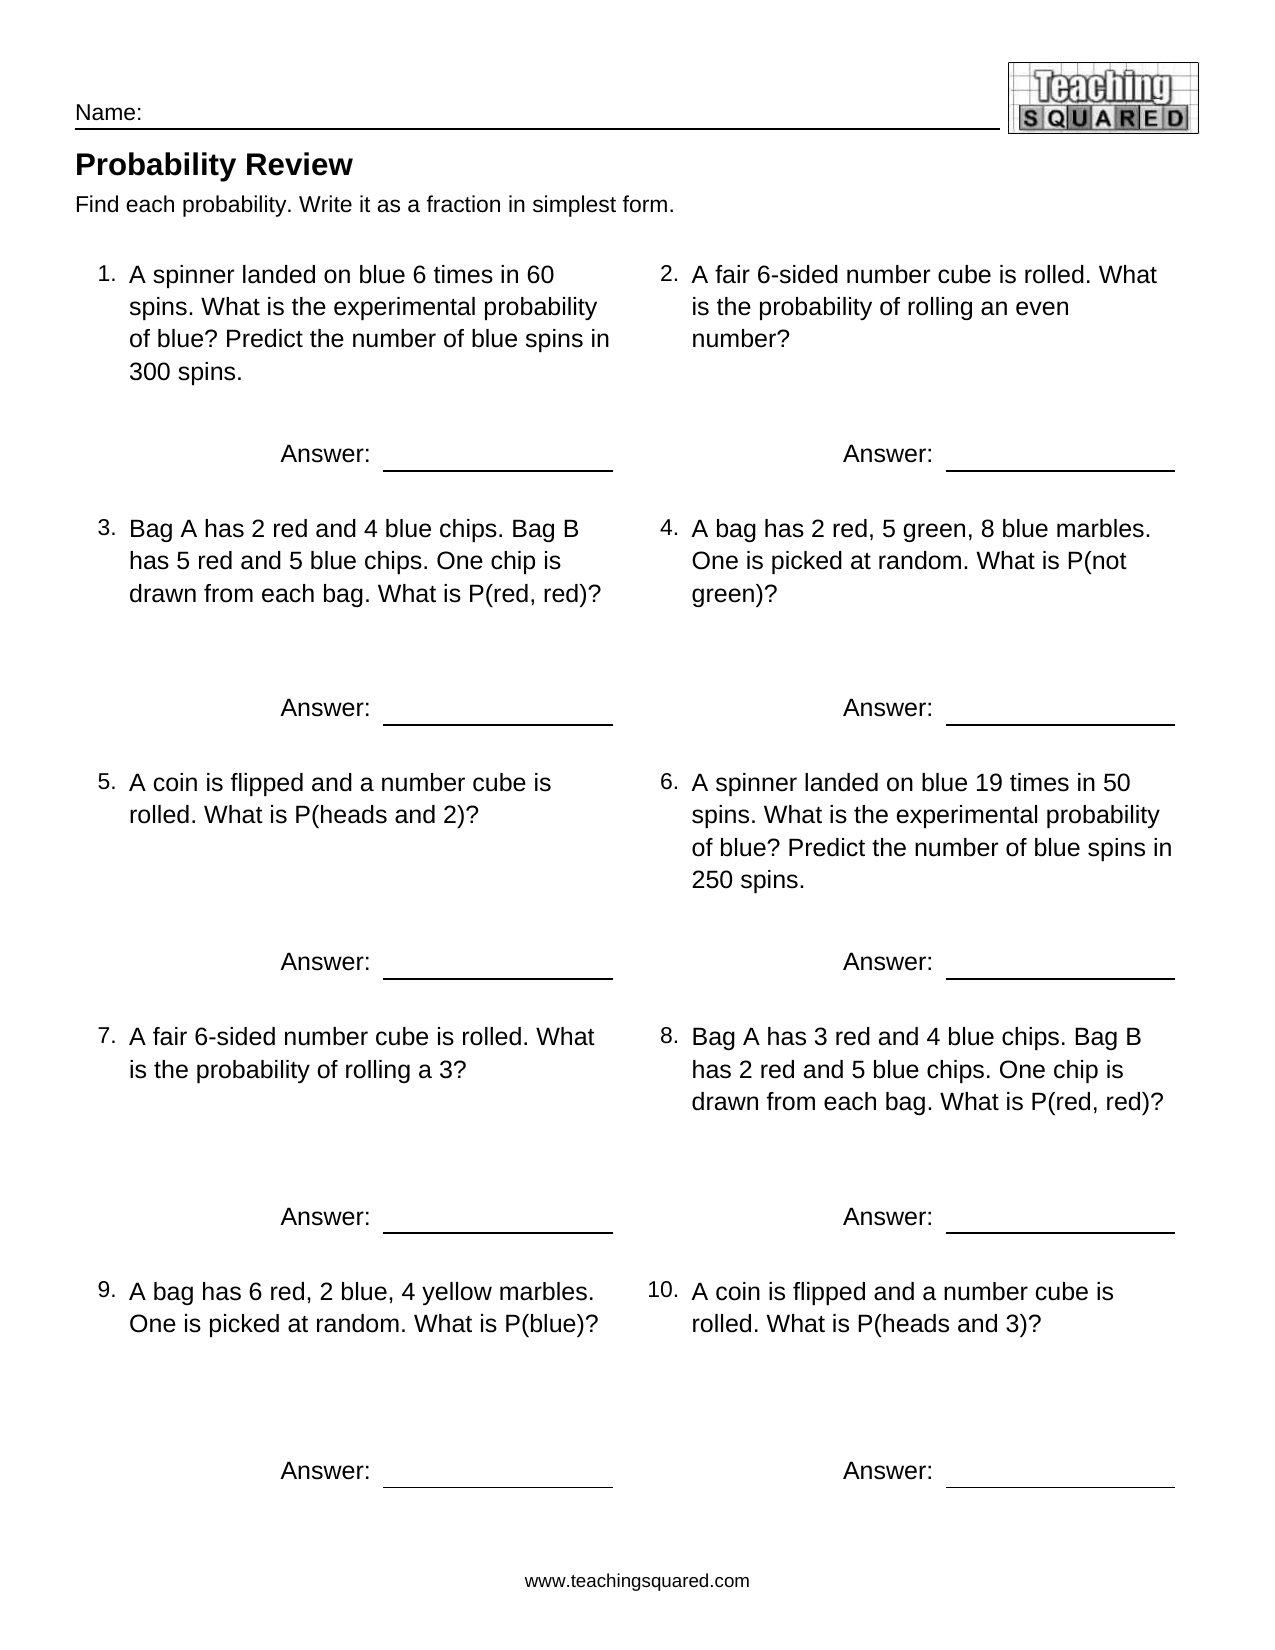
Probability Review worksheet
Probability Review

Sampling & Comparing Populations (7th Grade)

4 printable worksheets: Making Predictions from Samples, Random and Biased Samples, Comparing Populations with Mean and MAD and Sampling and Inference Review. The answer key is on page 2 of every PDF.

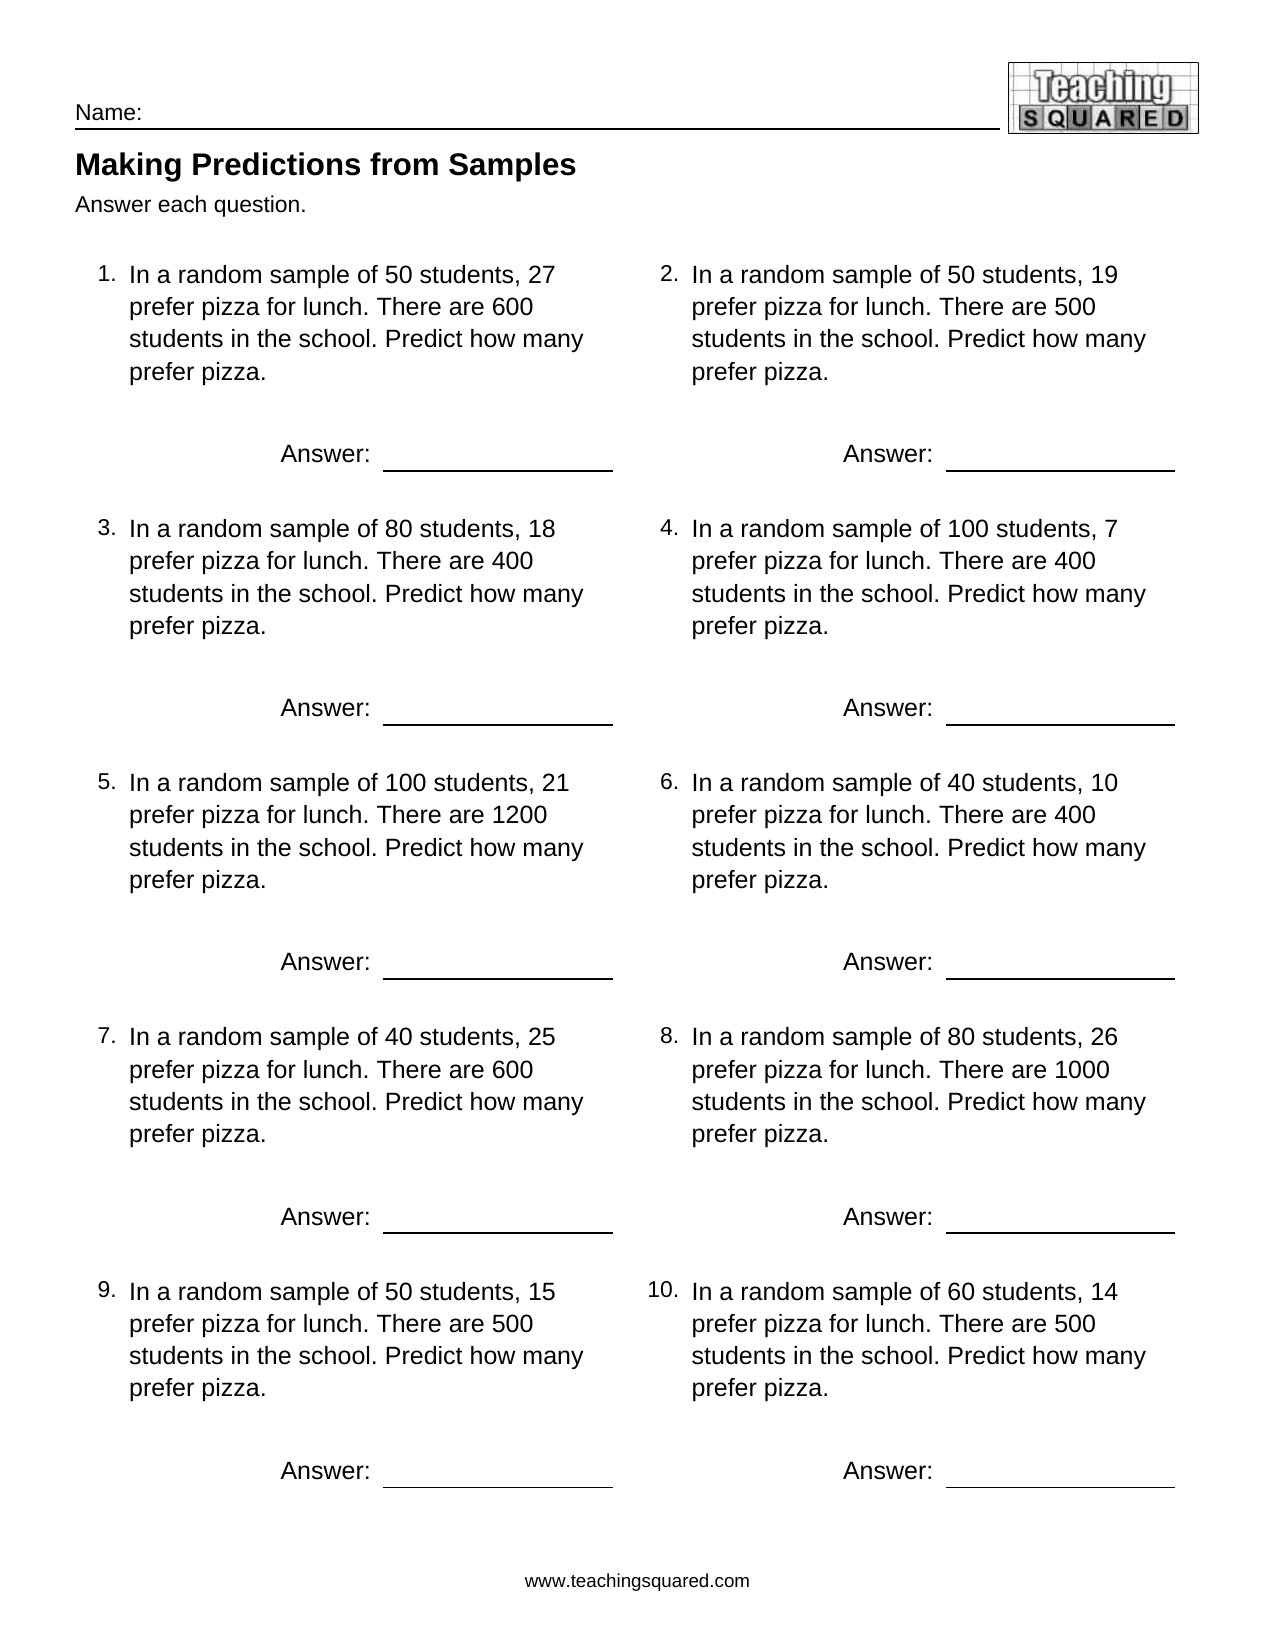
Making Predictions from Samples worksheet
Making Predictions from Samples
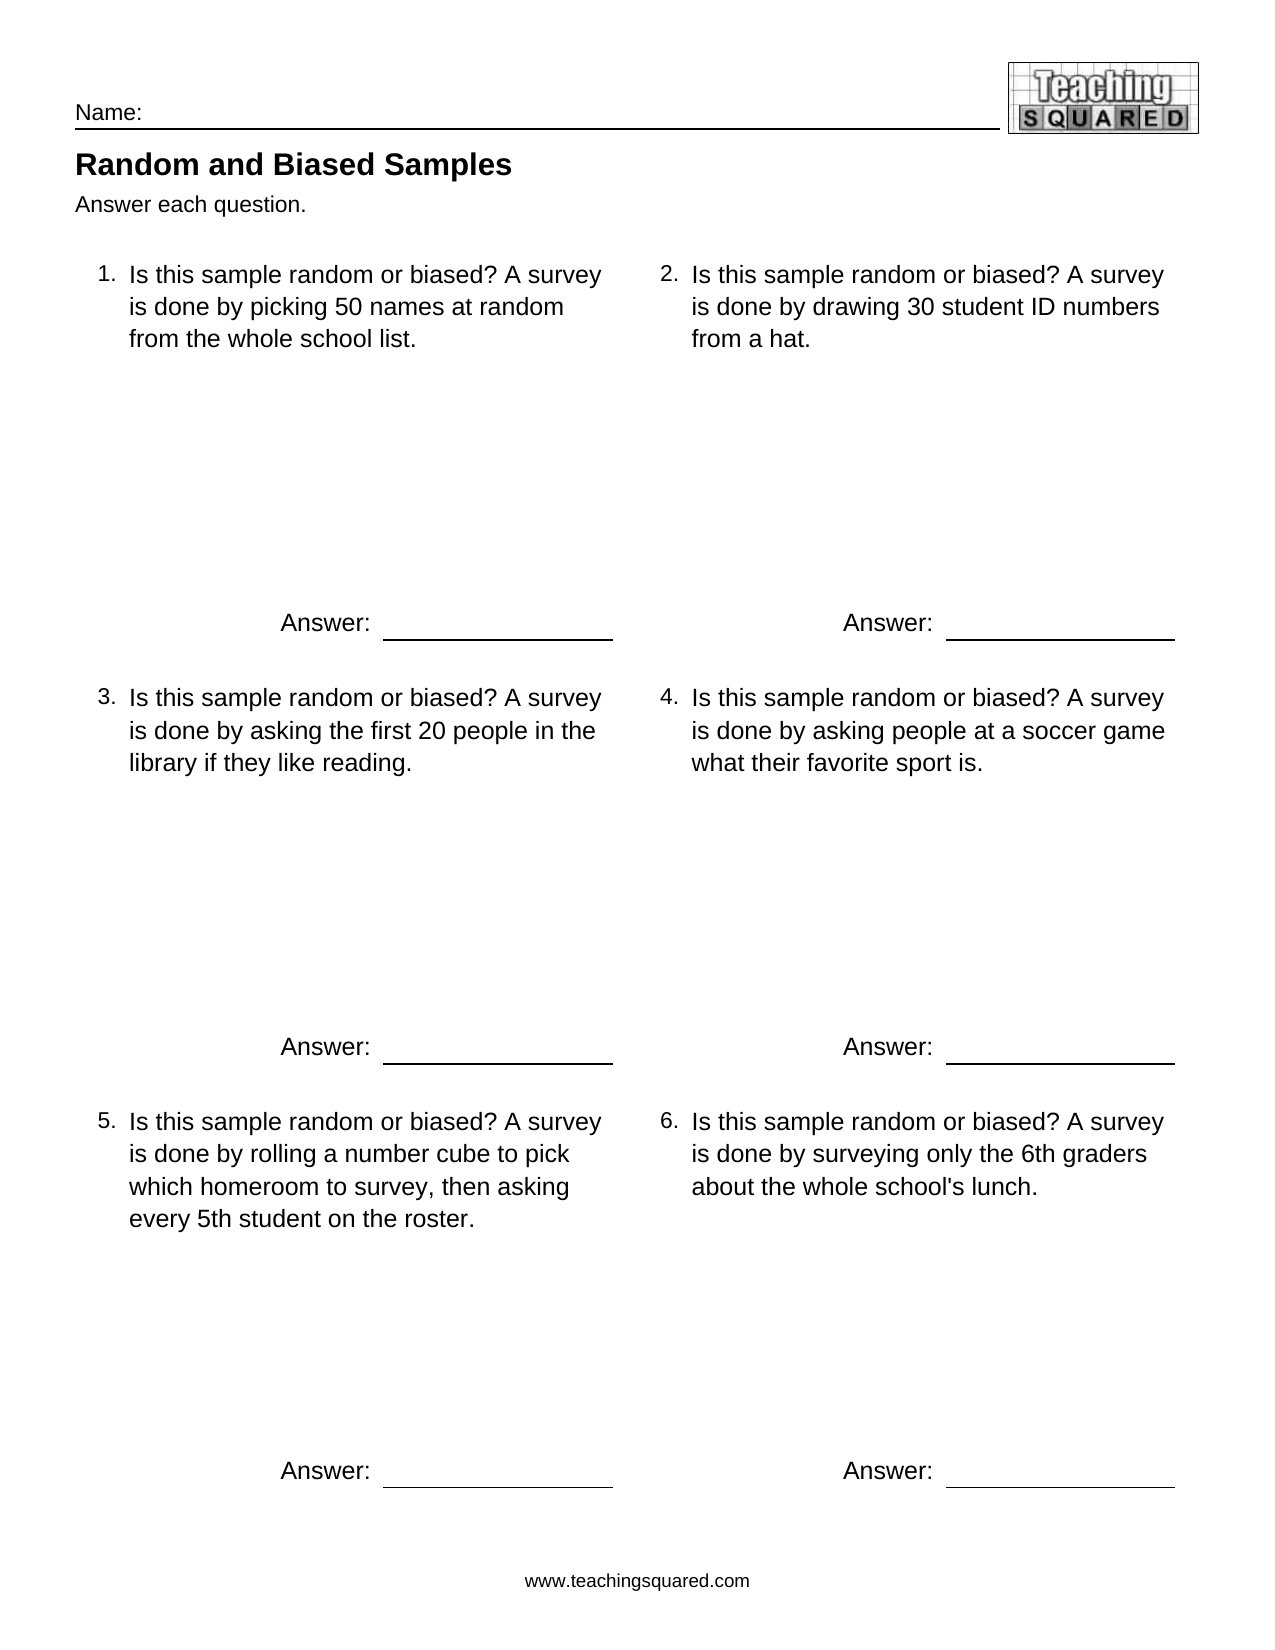
Random and Biased Samples worksheet
Random and Biased Samples
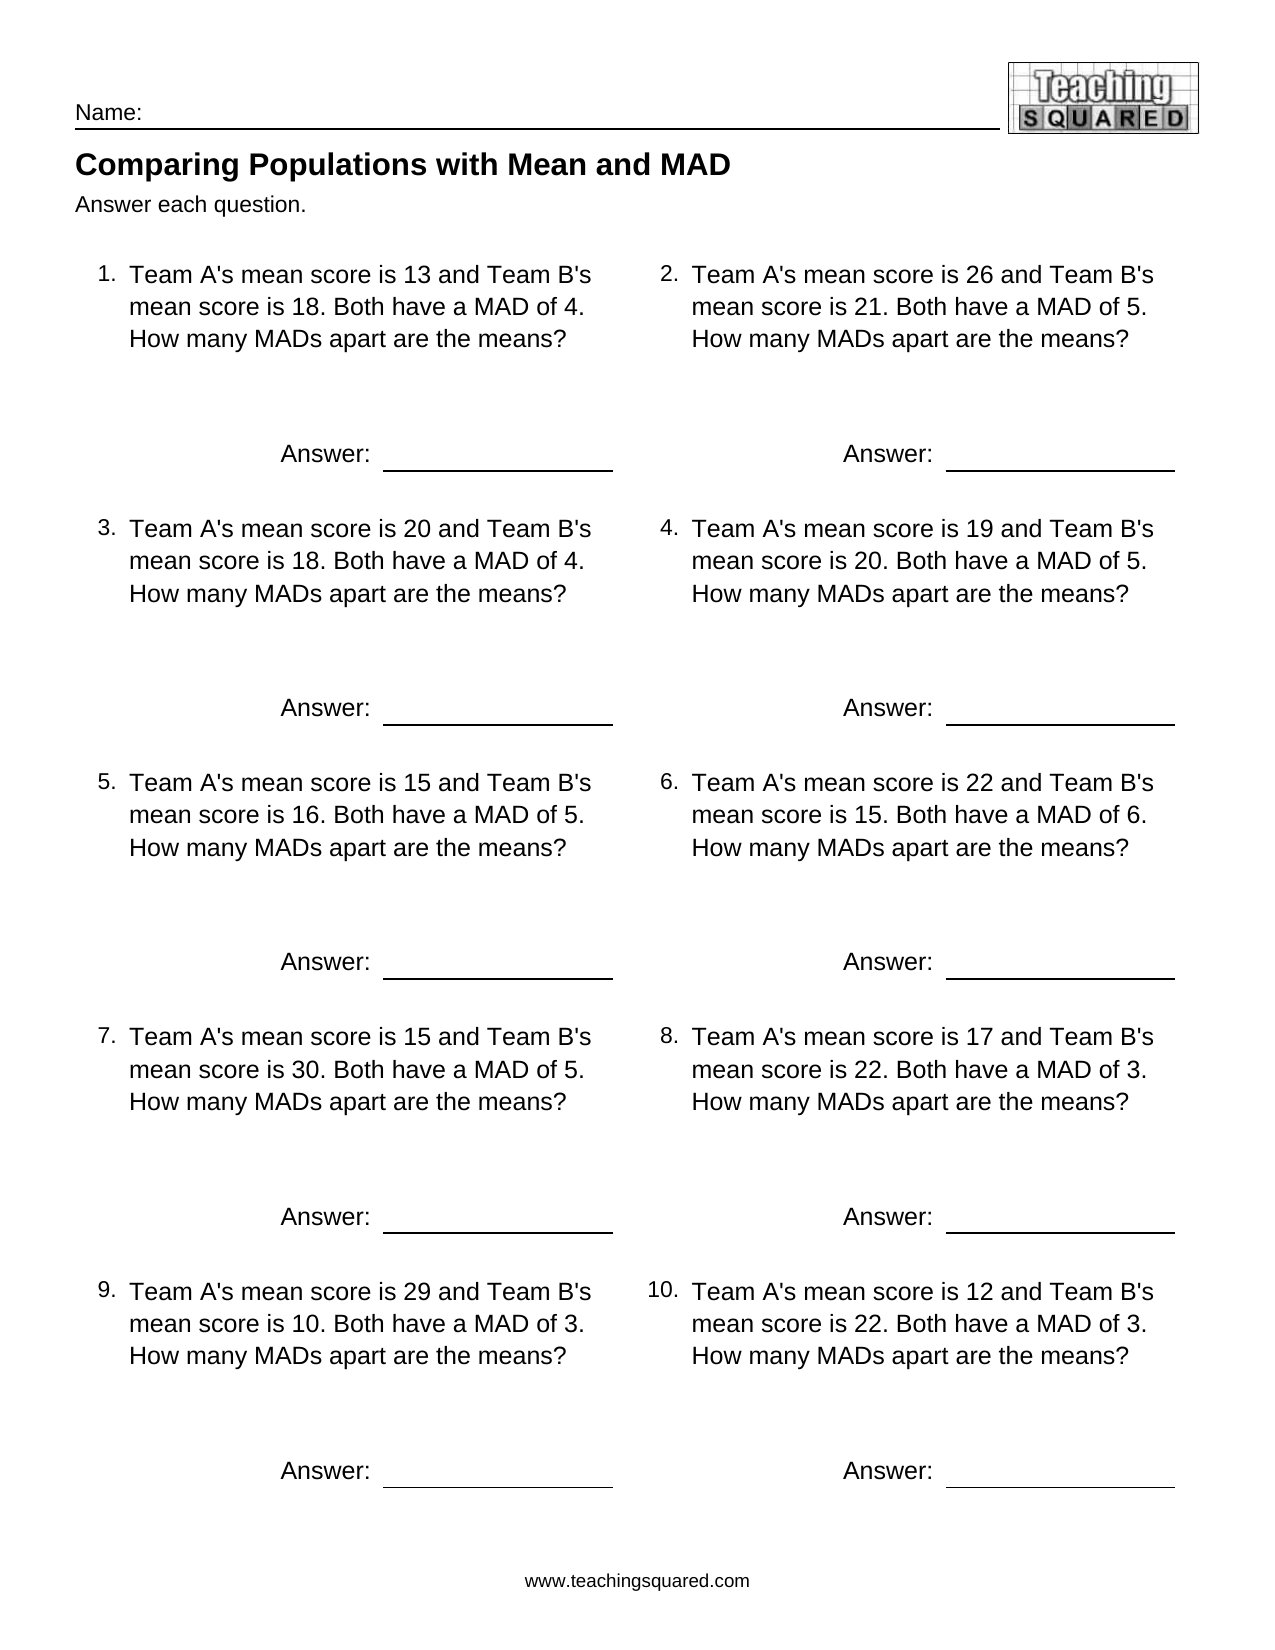
Comparing Populations with Mean and MAD worksheet
Comparing Populations with Mean and MAD
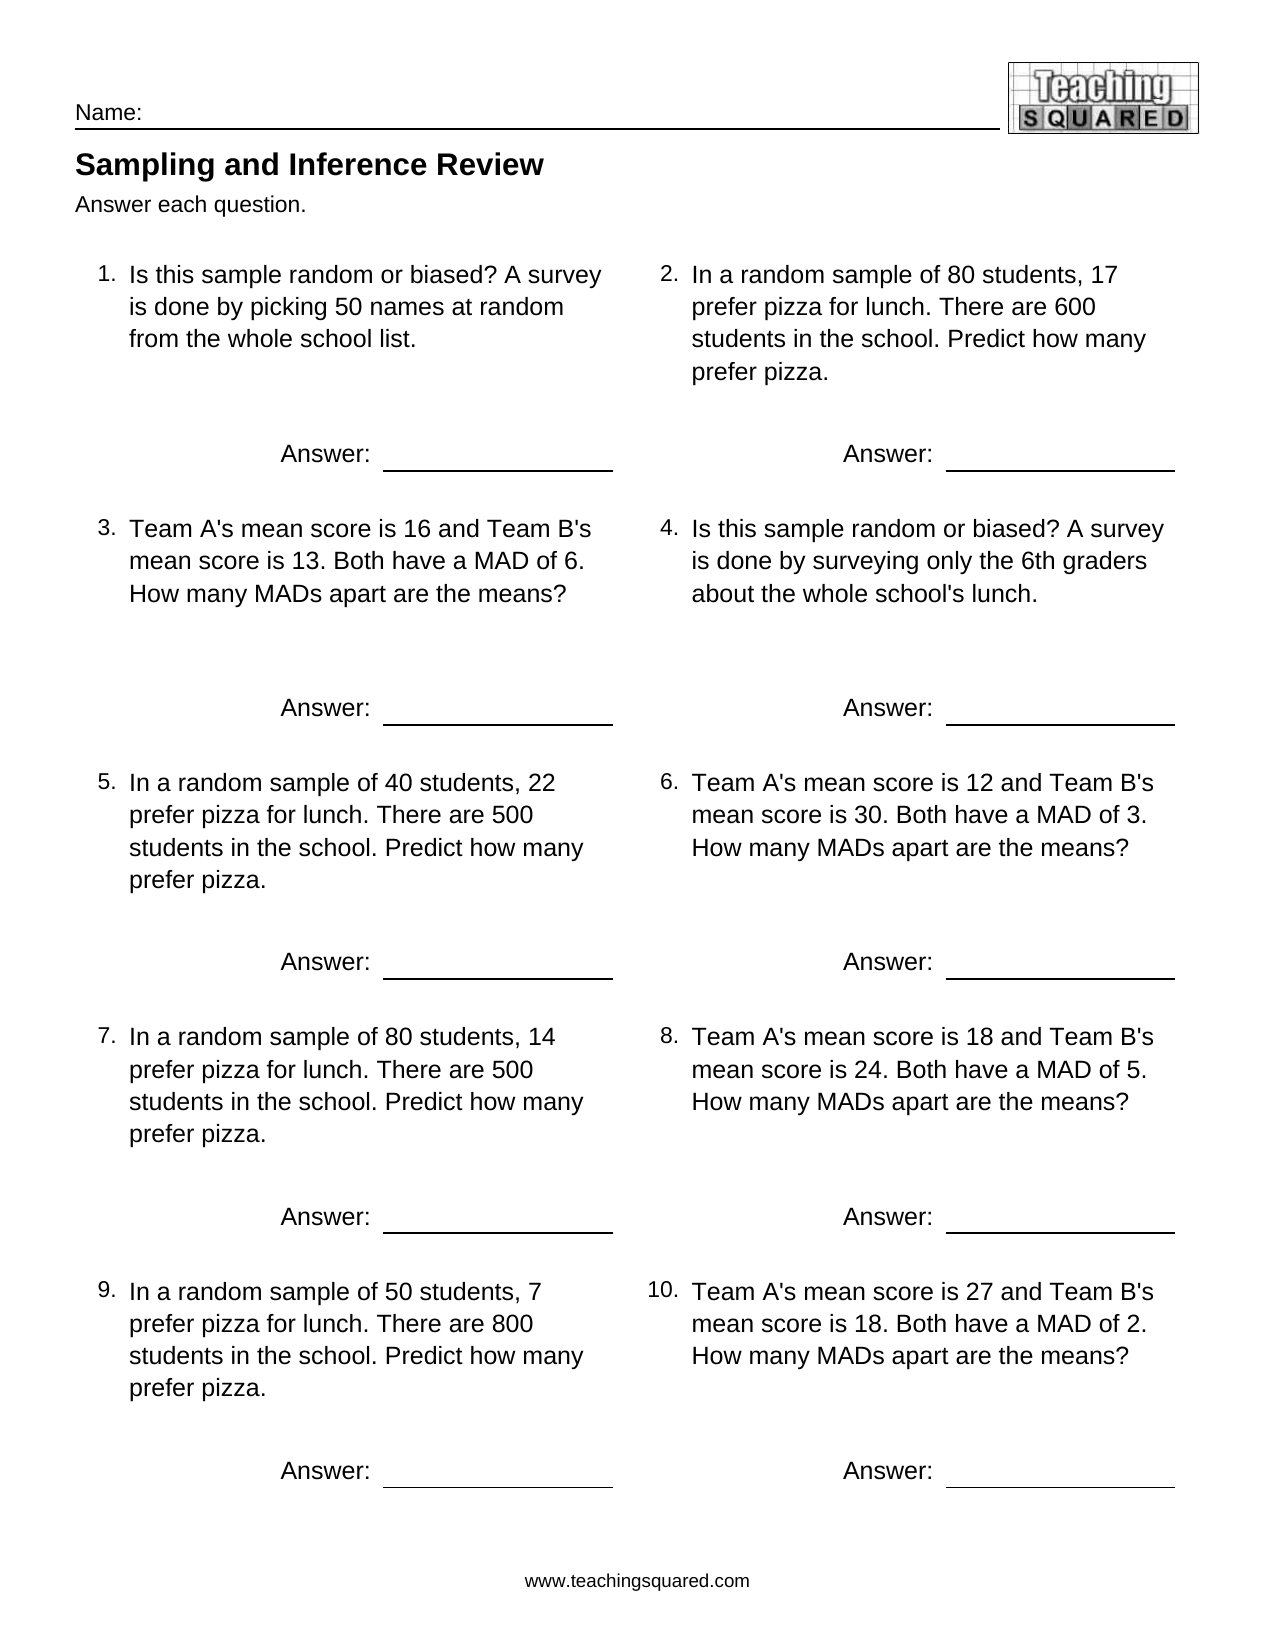
Sampling and Inference Review worksheet
Sampling and Inference Review

Scatter Plots & Two-way Tables (8th Grade)

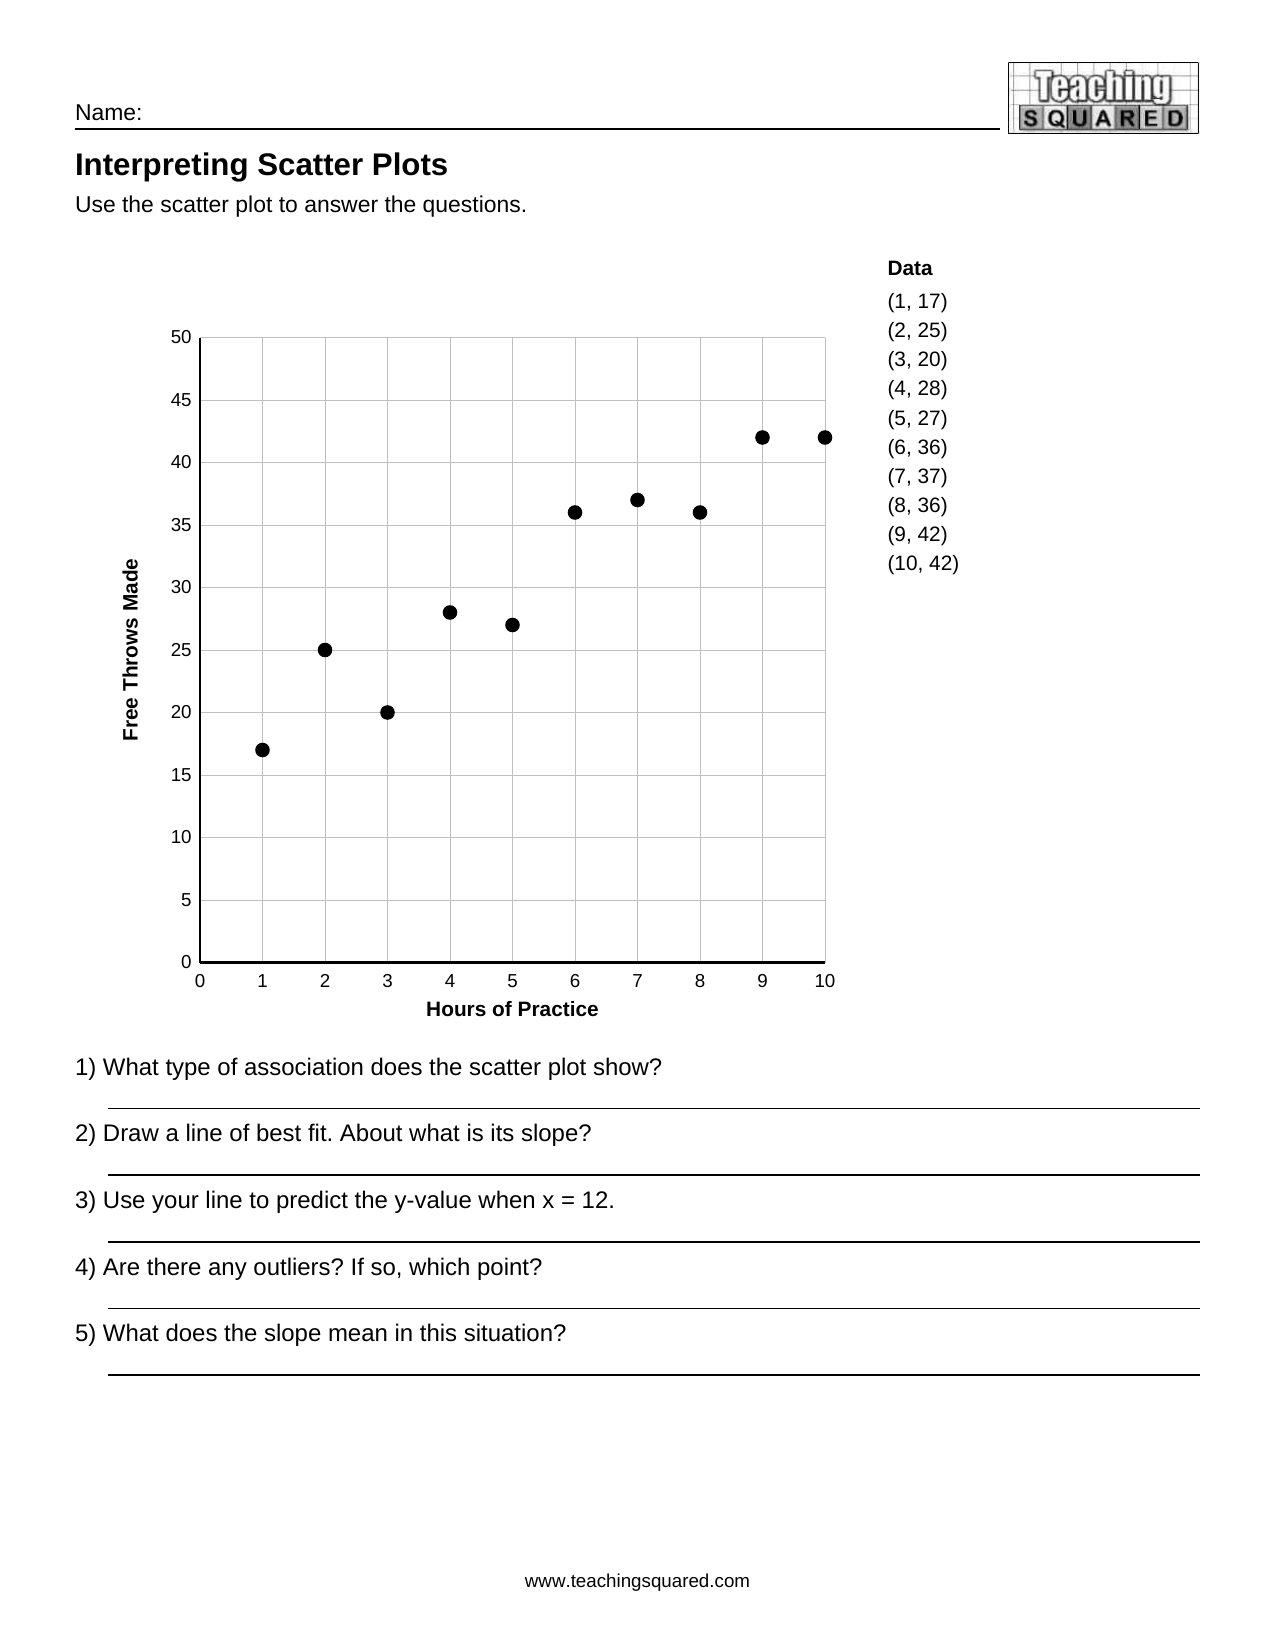
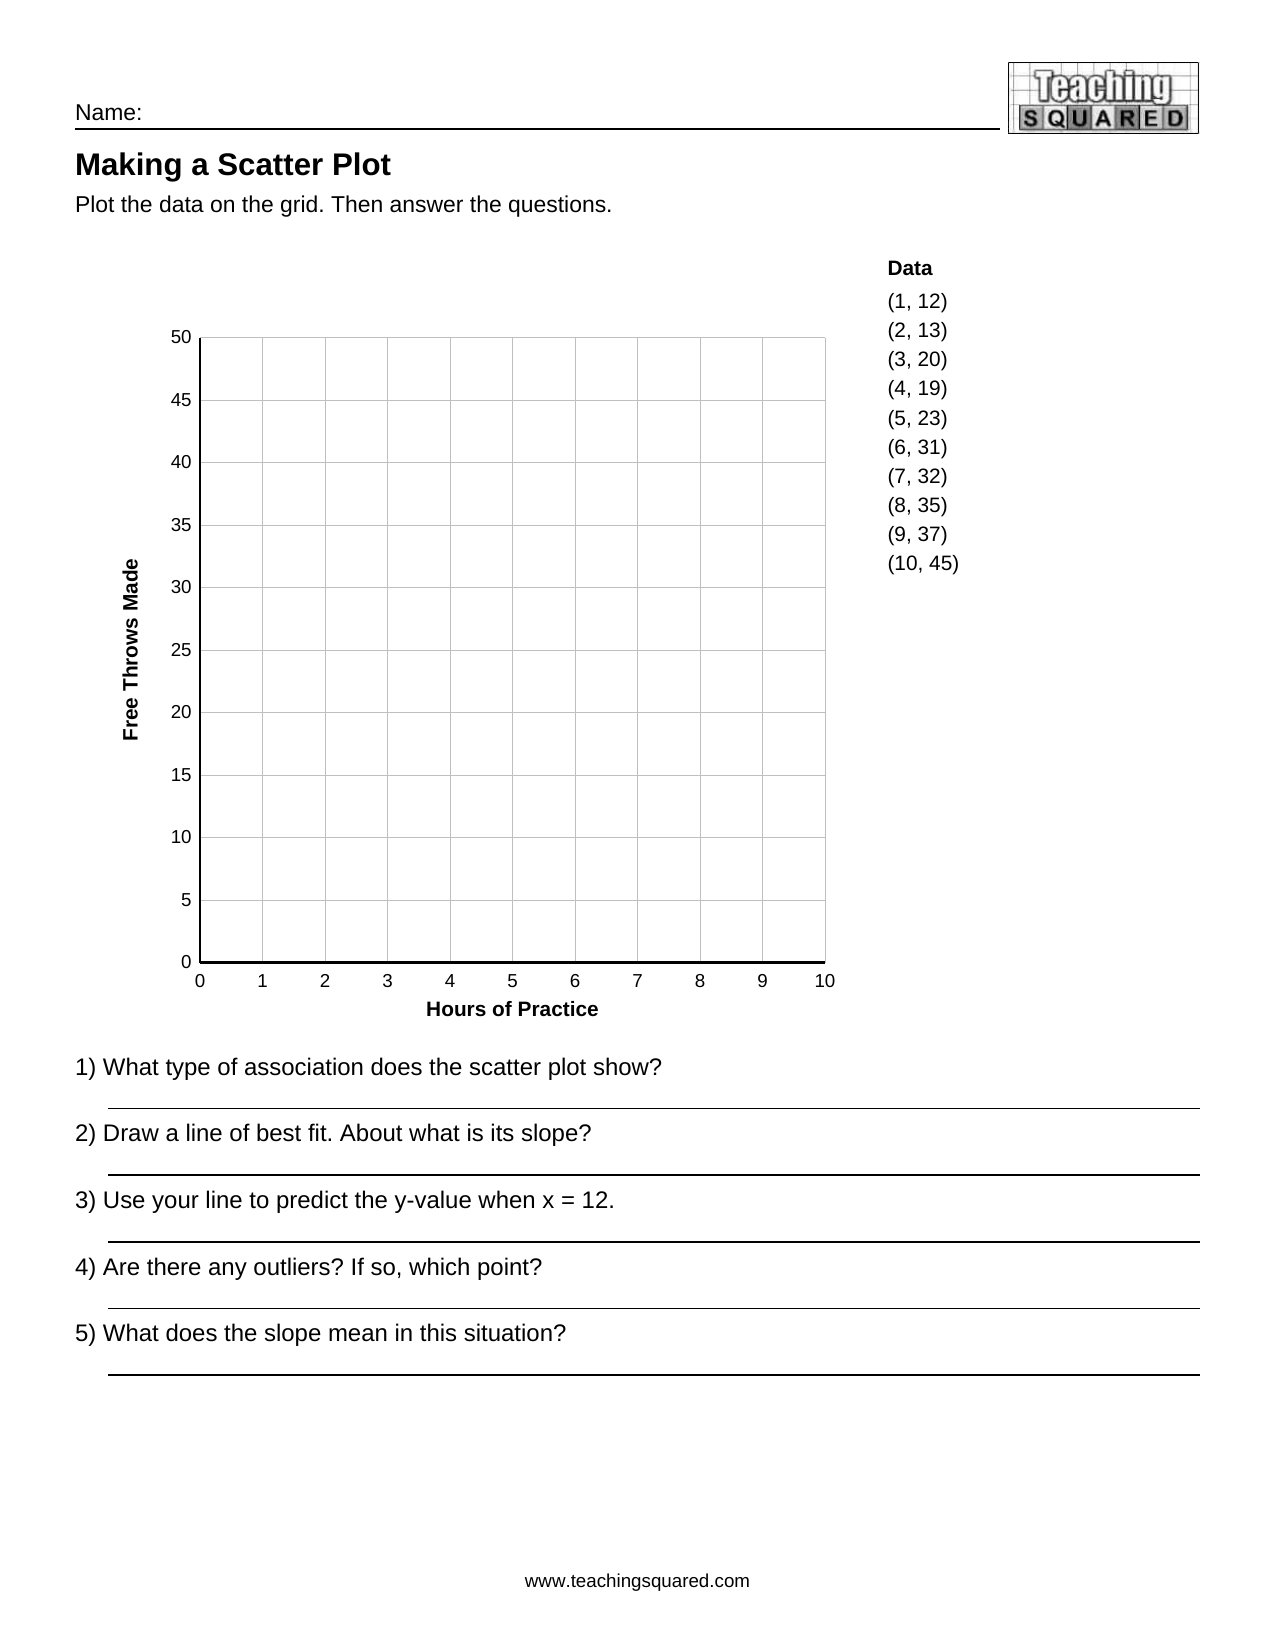
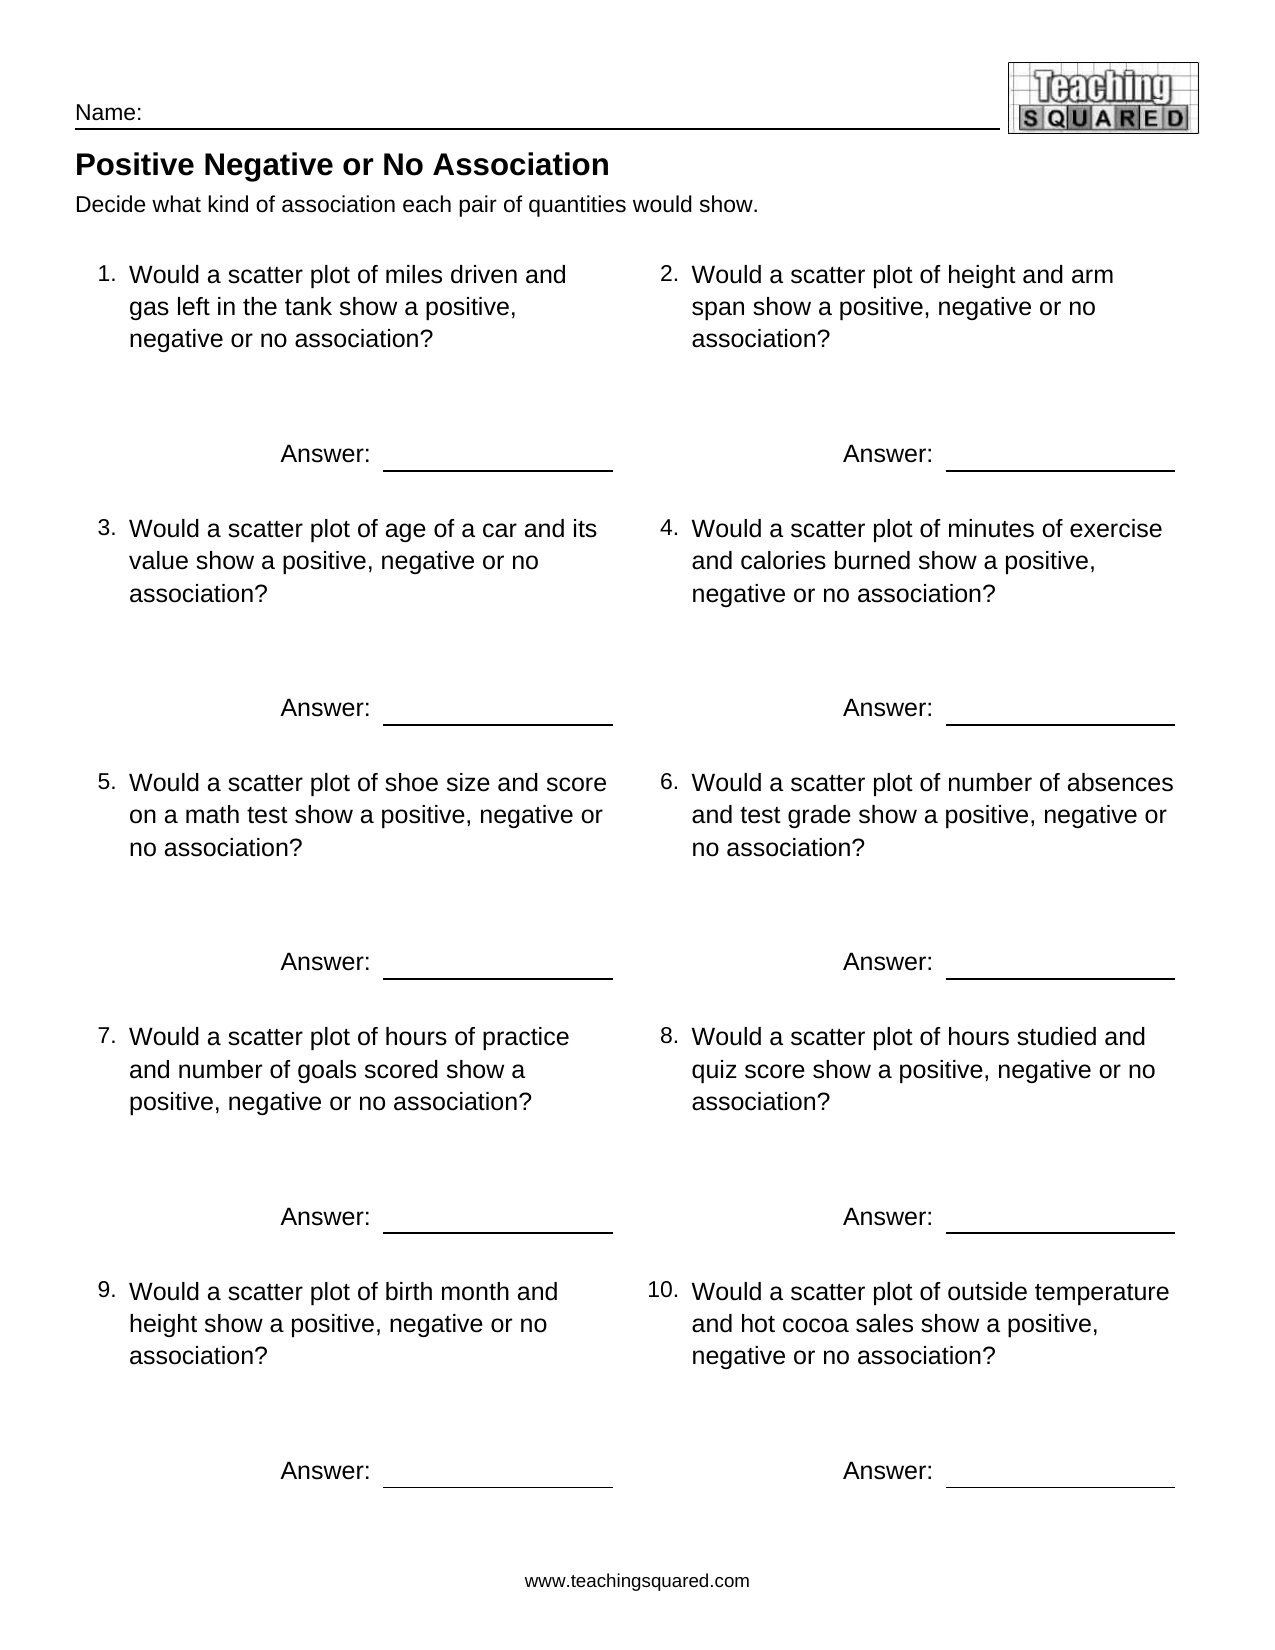
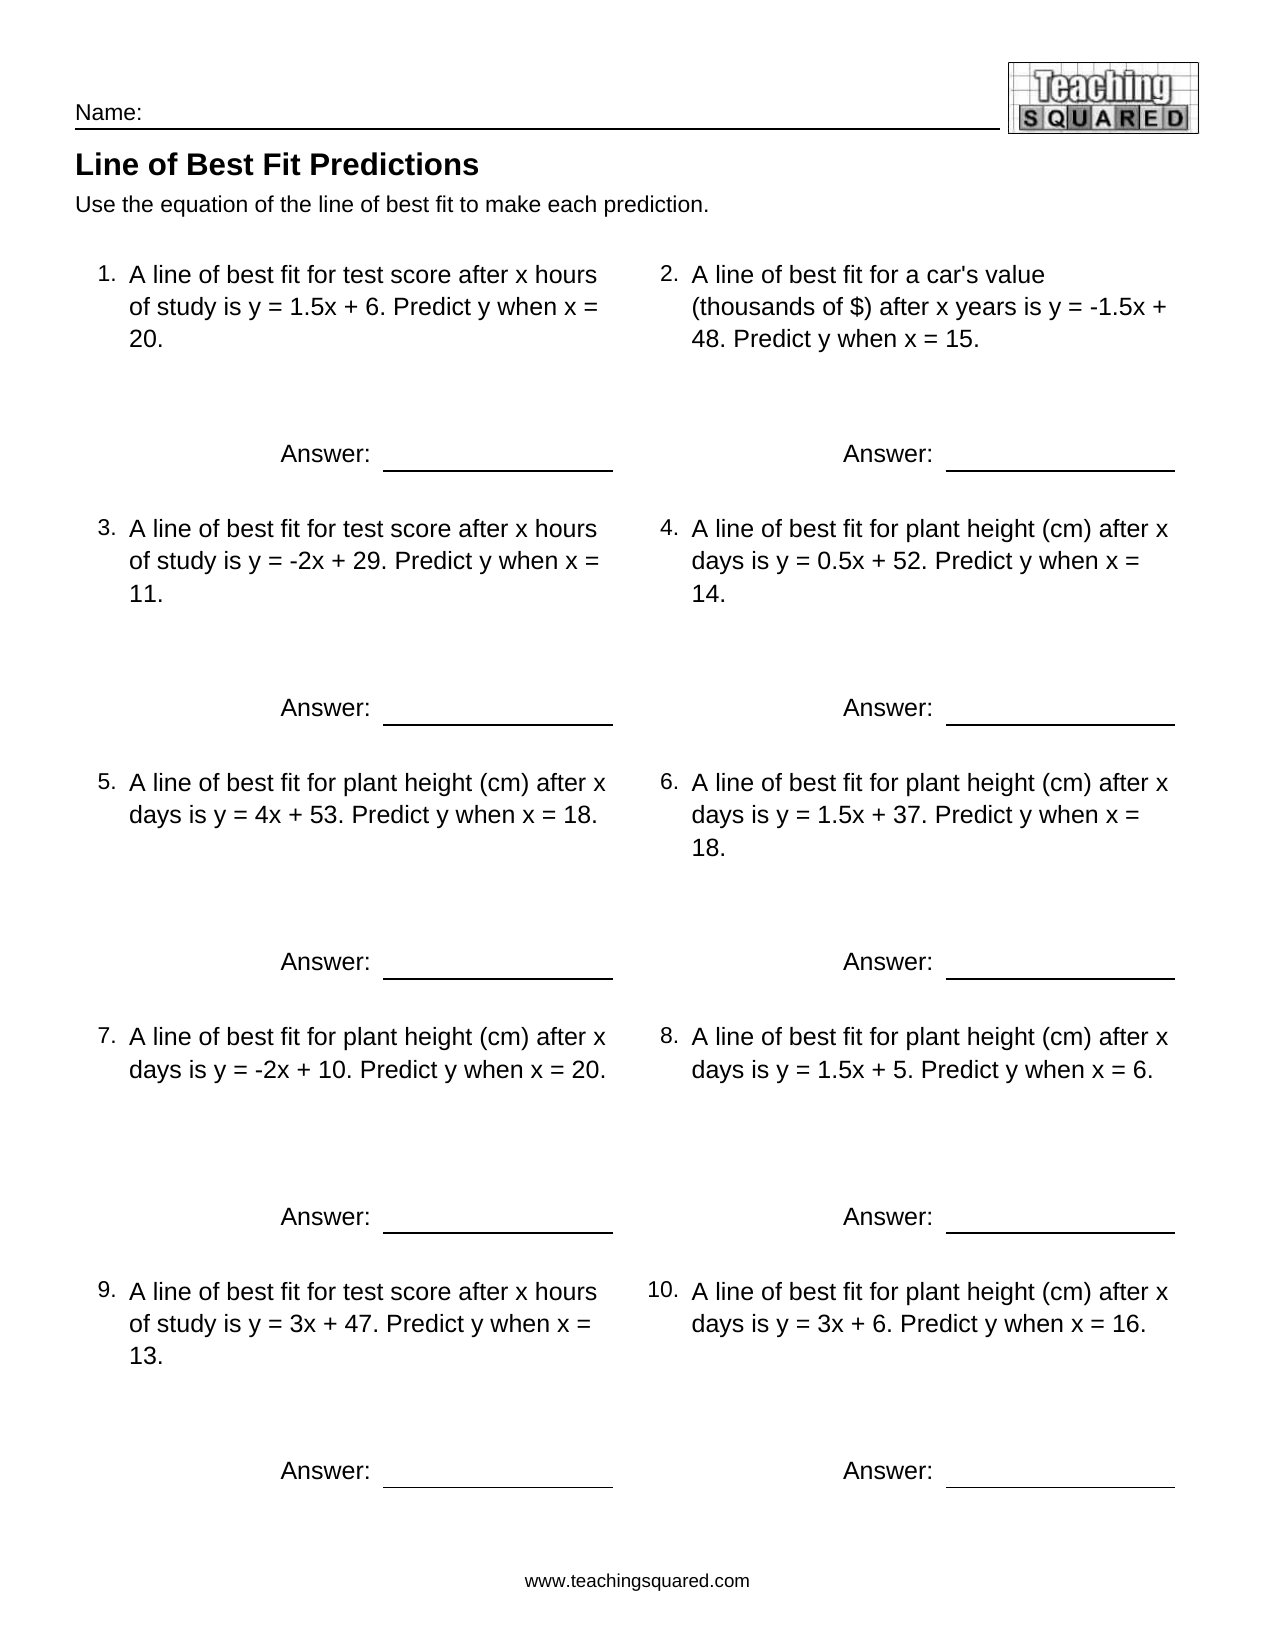
6 printable worksheets: Interpreting Scatter Plots, Making a Scatter Plot, Positive Negative or No Association, Line of Best Fit Predictions, Two-Way Tables and Relative Frequency in Two-Way Tables. The answer key is on page 2 of every PDF.

Interpreting Scatter Plots worksheet
Interpreting Scatter Plots
Making a Scatter Plot worksheet
Making a Scatter Plot
Positive Negative or No Association worksheet
Positive Negative or No Association
Line of Best Fit Predictions worksheet
Line of Best Fit Predictions
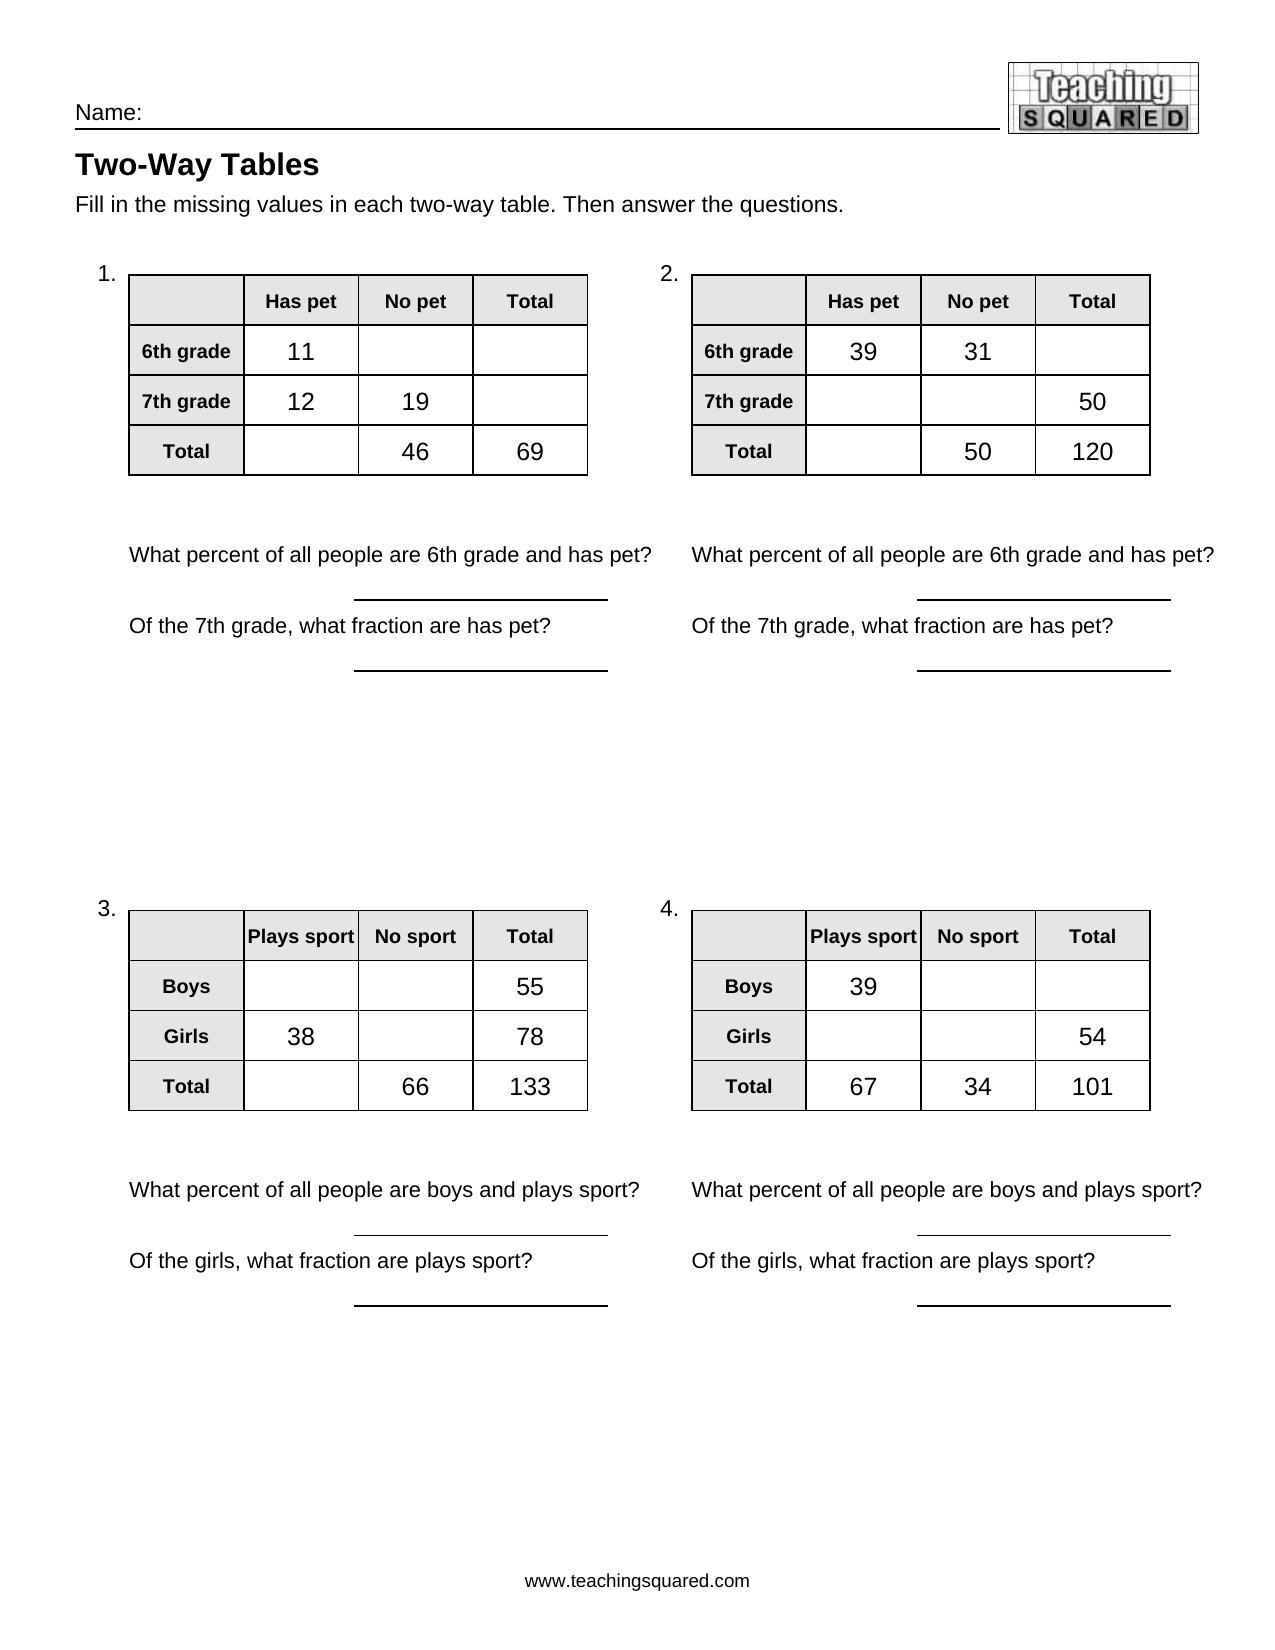
Two-Way Tables worksheet
Two-Way Tables
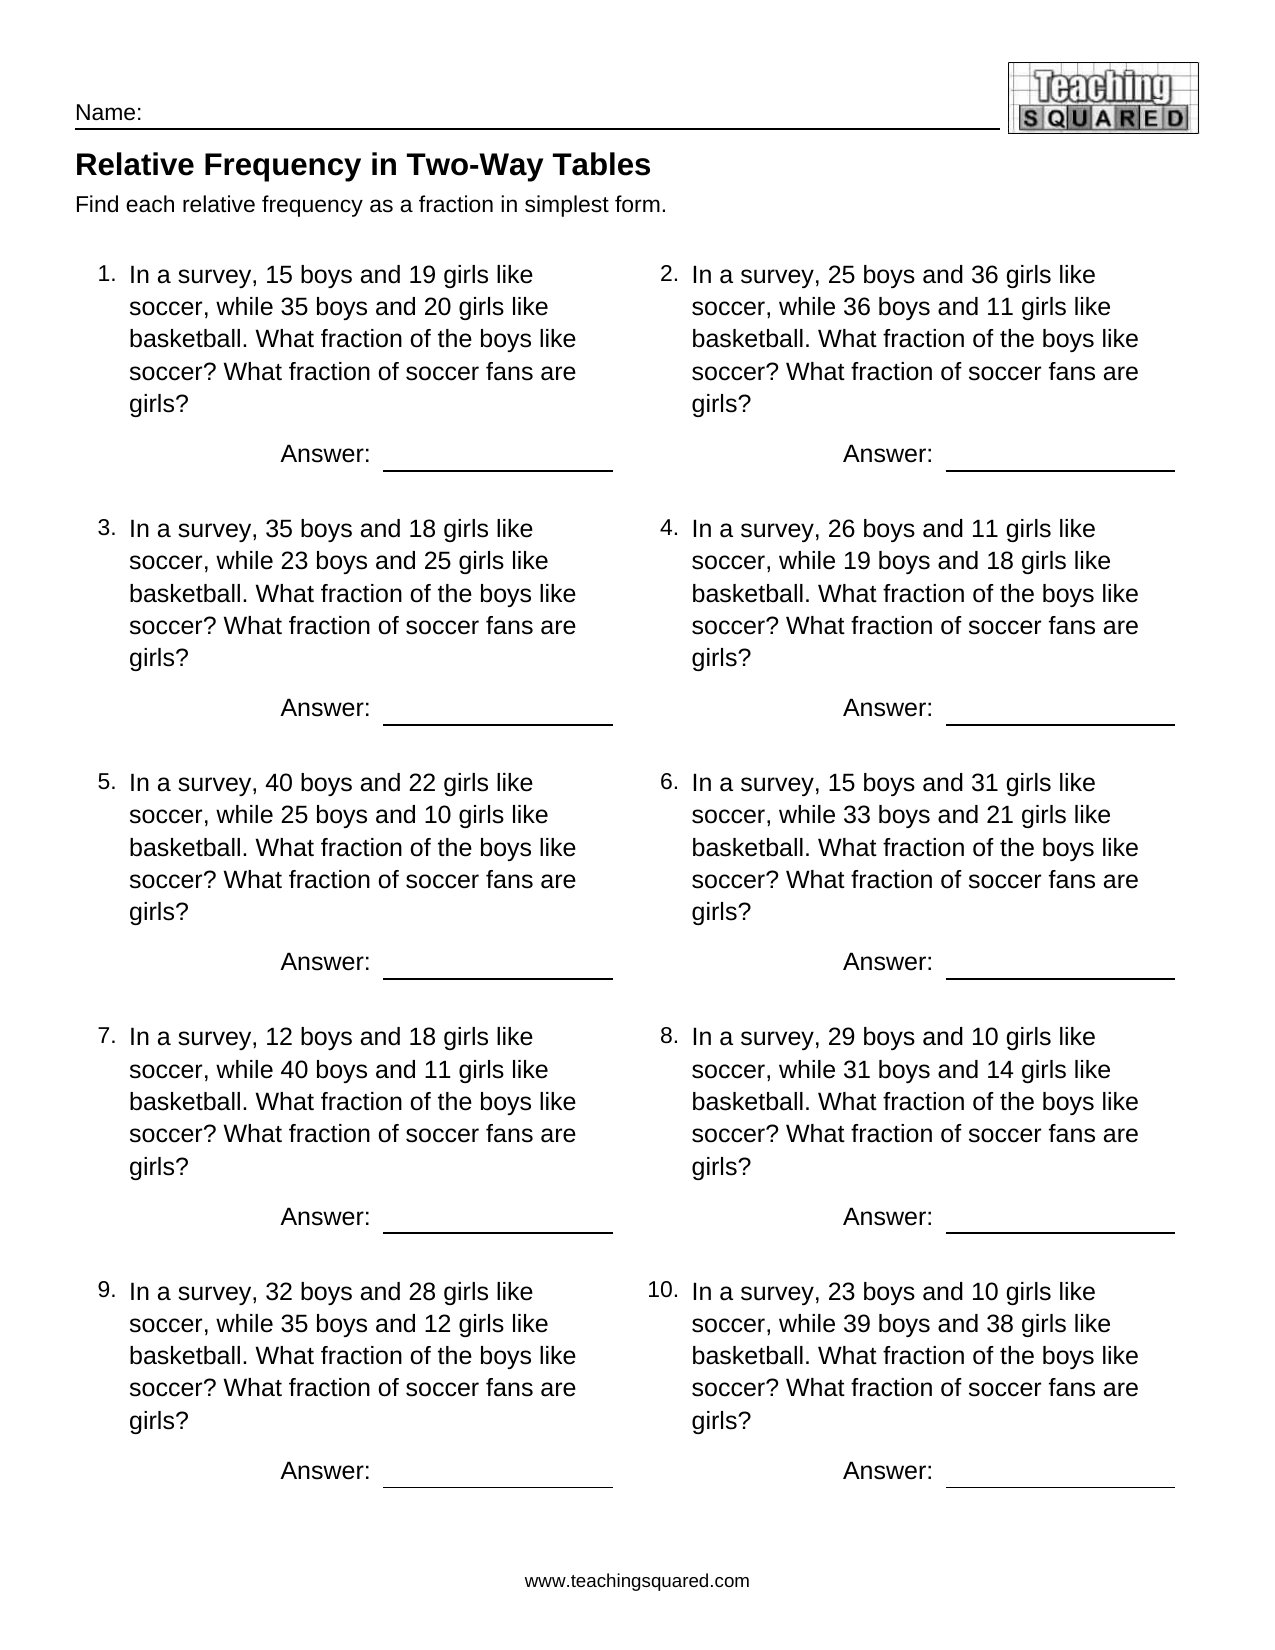
Relative Frequency in Two-Way Tables worksheet
Relative Frequency in Two-Way Tables

See all worksheets for 6th grade math, 7th grade math, 8th grade math.