
Students plot ten ordered pairs to make a scatter plot, then describe the association and use a line of best fit to make predictions.
Click on the image to open the Making a Scatter Plot PDF. Print it to use the worksheet. The answer key is on page 2.
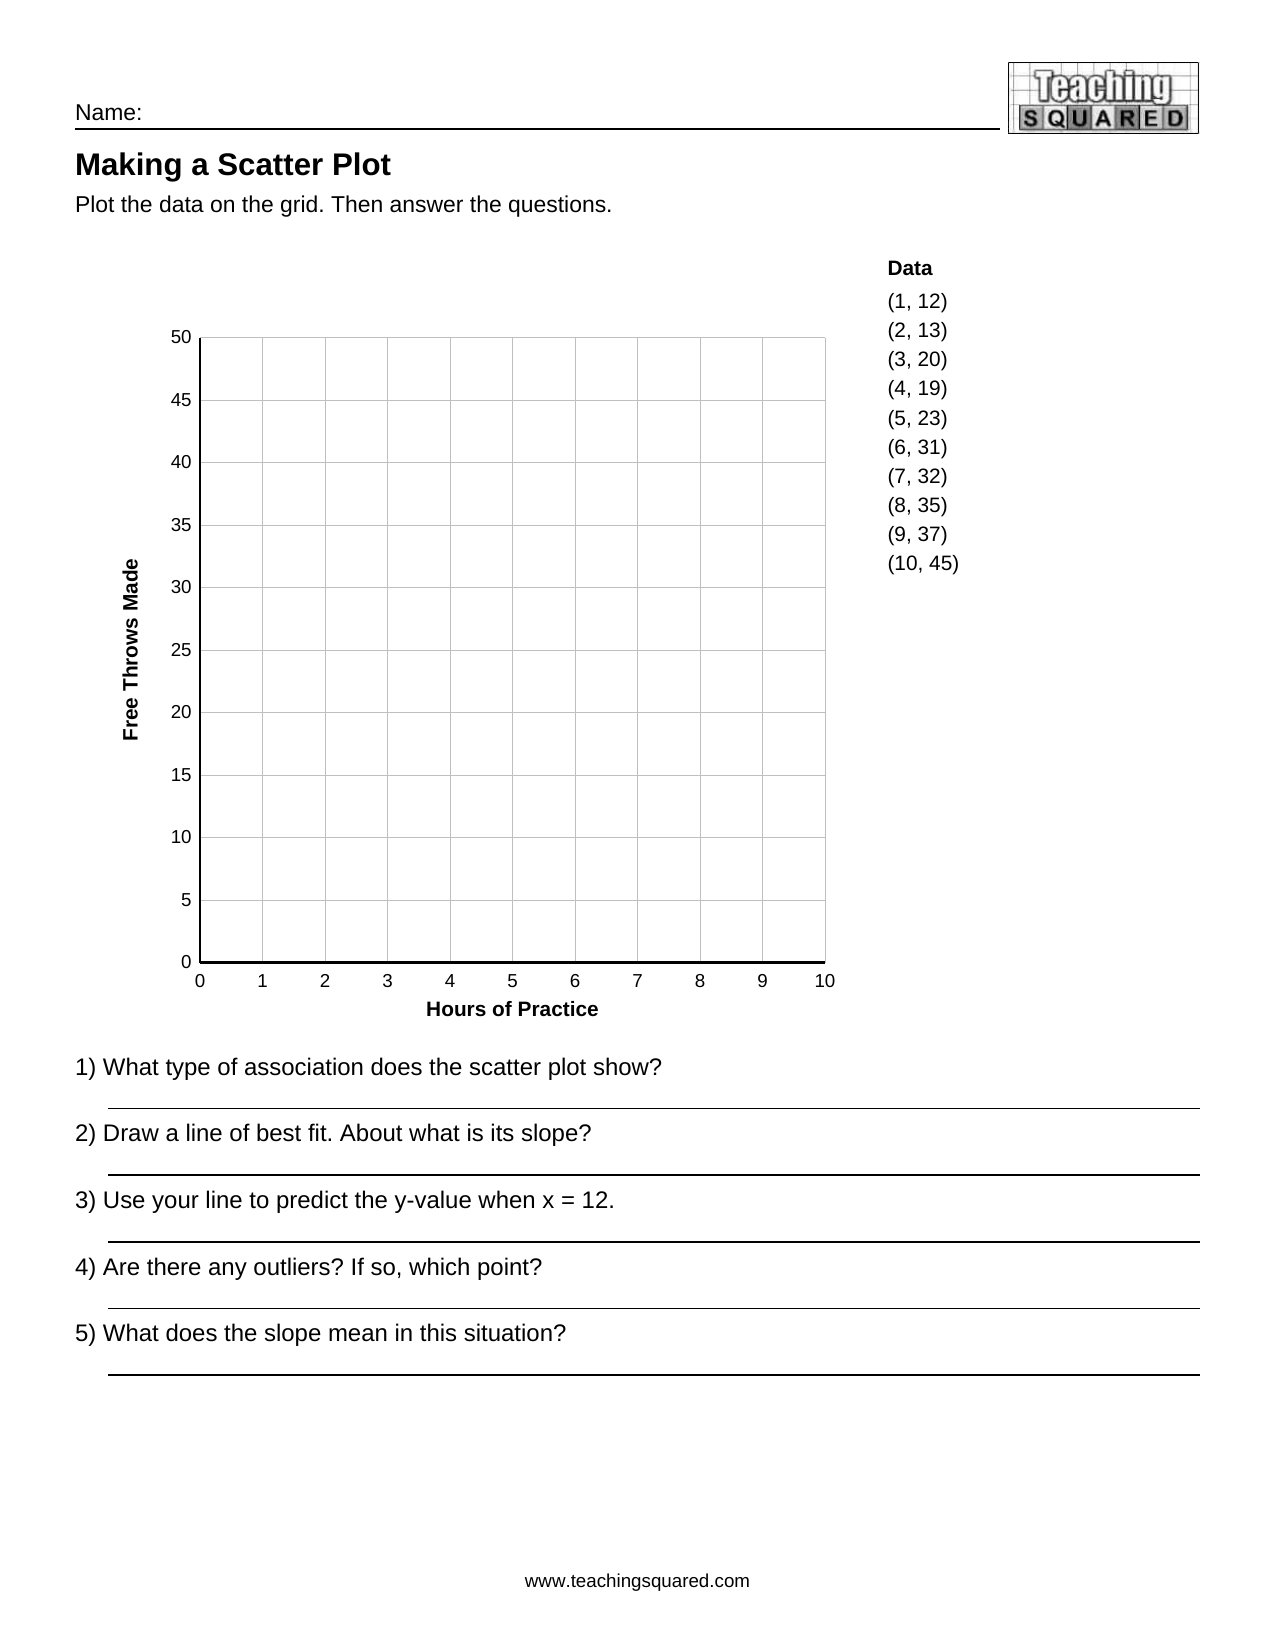 Making a Scatter Plot
Use this free 8th grade math worksheet from Teaching Squared. Find more in Statistics and Probability Worksheets and 8th Grade Math Worksheets.