
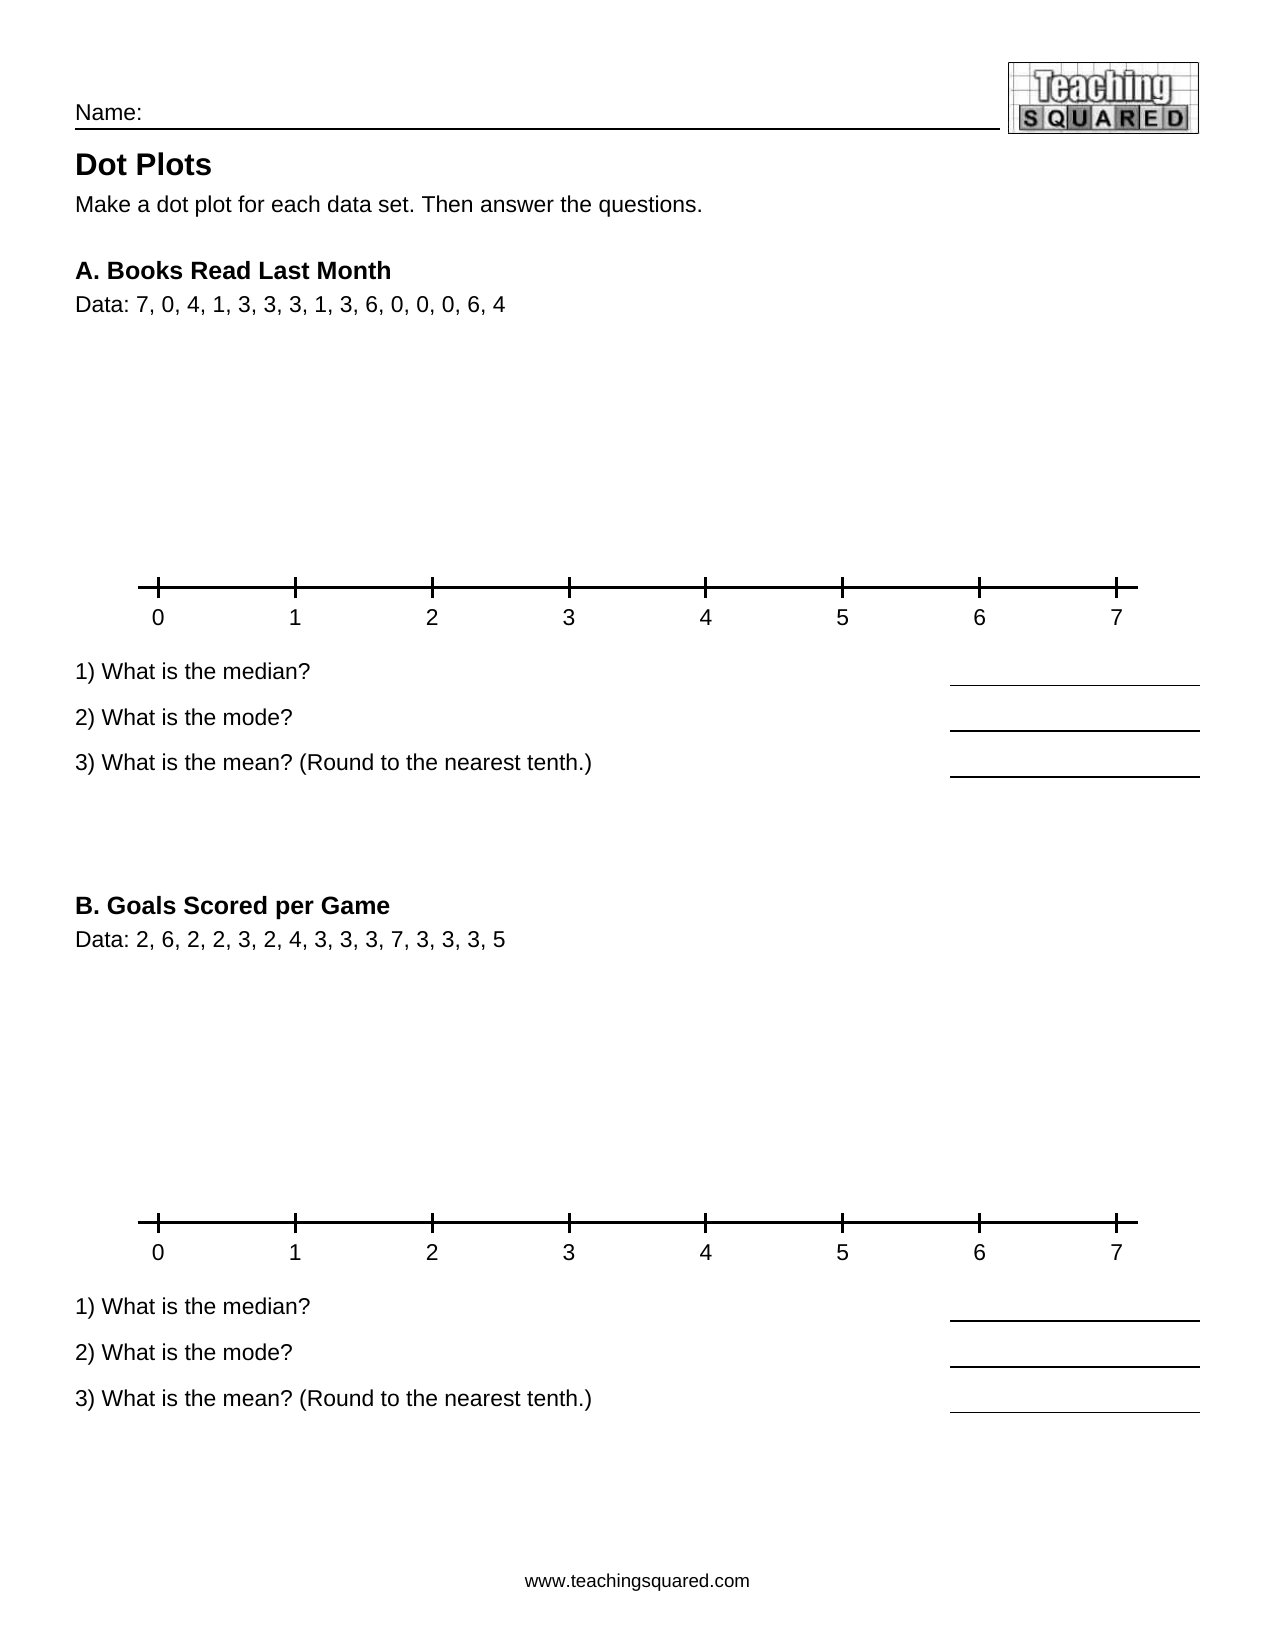
Two data sets of fifteen values, books read and goals scored, ask students to build dot plots and find the median, mode and mean (6.SP.4-5).
Click on the image to open the Dot Plots PDF. Print it to use the worksheet. The answer key is on page 2.
 Dot Plots
Use this free 6th grade math worksheet from Teaching Squared. Find more in Statistics and Probability Worksheets and 6th Grade Math Worksheets.