
A scatter plot of ten data points asks students to describe the association, draw a line of best fit, estimate its slope and make a prediction (8.SP.1-3).
Click on the image to open the Interpreting Scatter Plots PDF. Print it to use the worksheet. The answer key is on page 2.
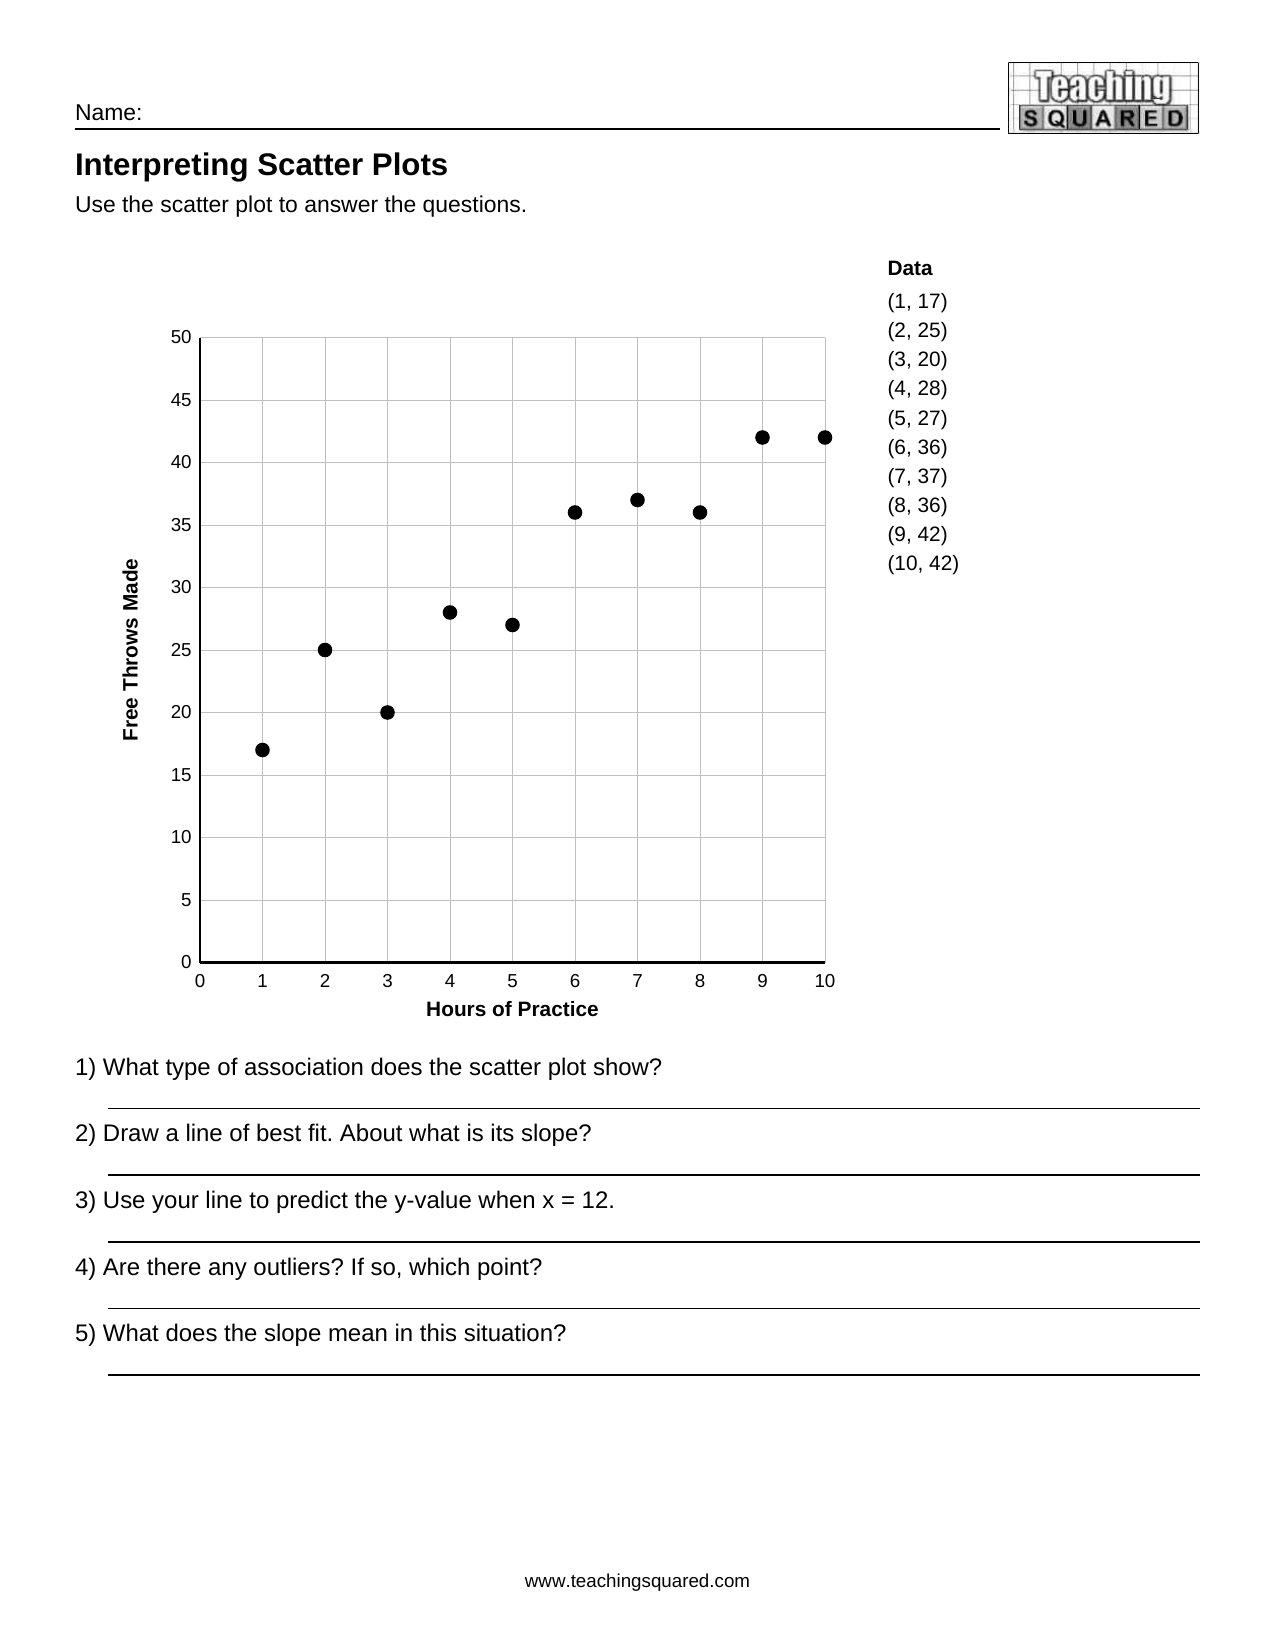 Interpreting Scatter Plots
Use this free 8th grade math worksheet from Teaching Squared. Find more in Statistics and Probability Worksheets and 8th Grade Math Worksheets.