
This page practices comparing two groups by how many MADs apart their means are (7.SP.1-4). Example: "Team A's mean score is 13 and Team B's mean score is 18. Both have a MAD of 4. How many MADs apart are the means?"
Click on the image to open the Comparing Populations with Mean and MAD PDF. Print it to use the worksheet. The answer key is on page 2.
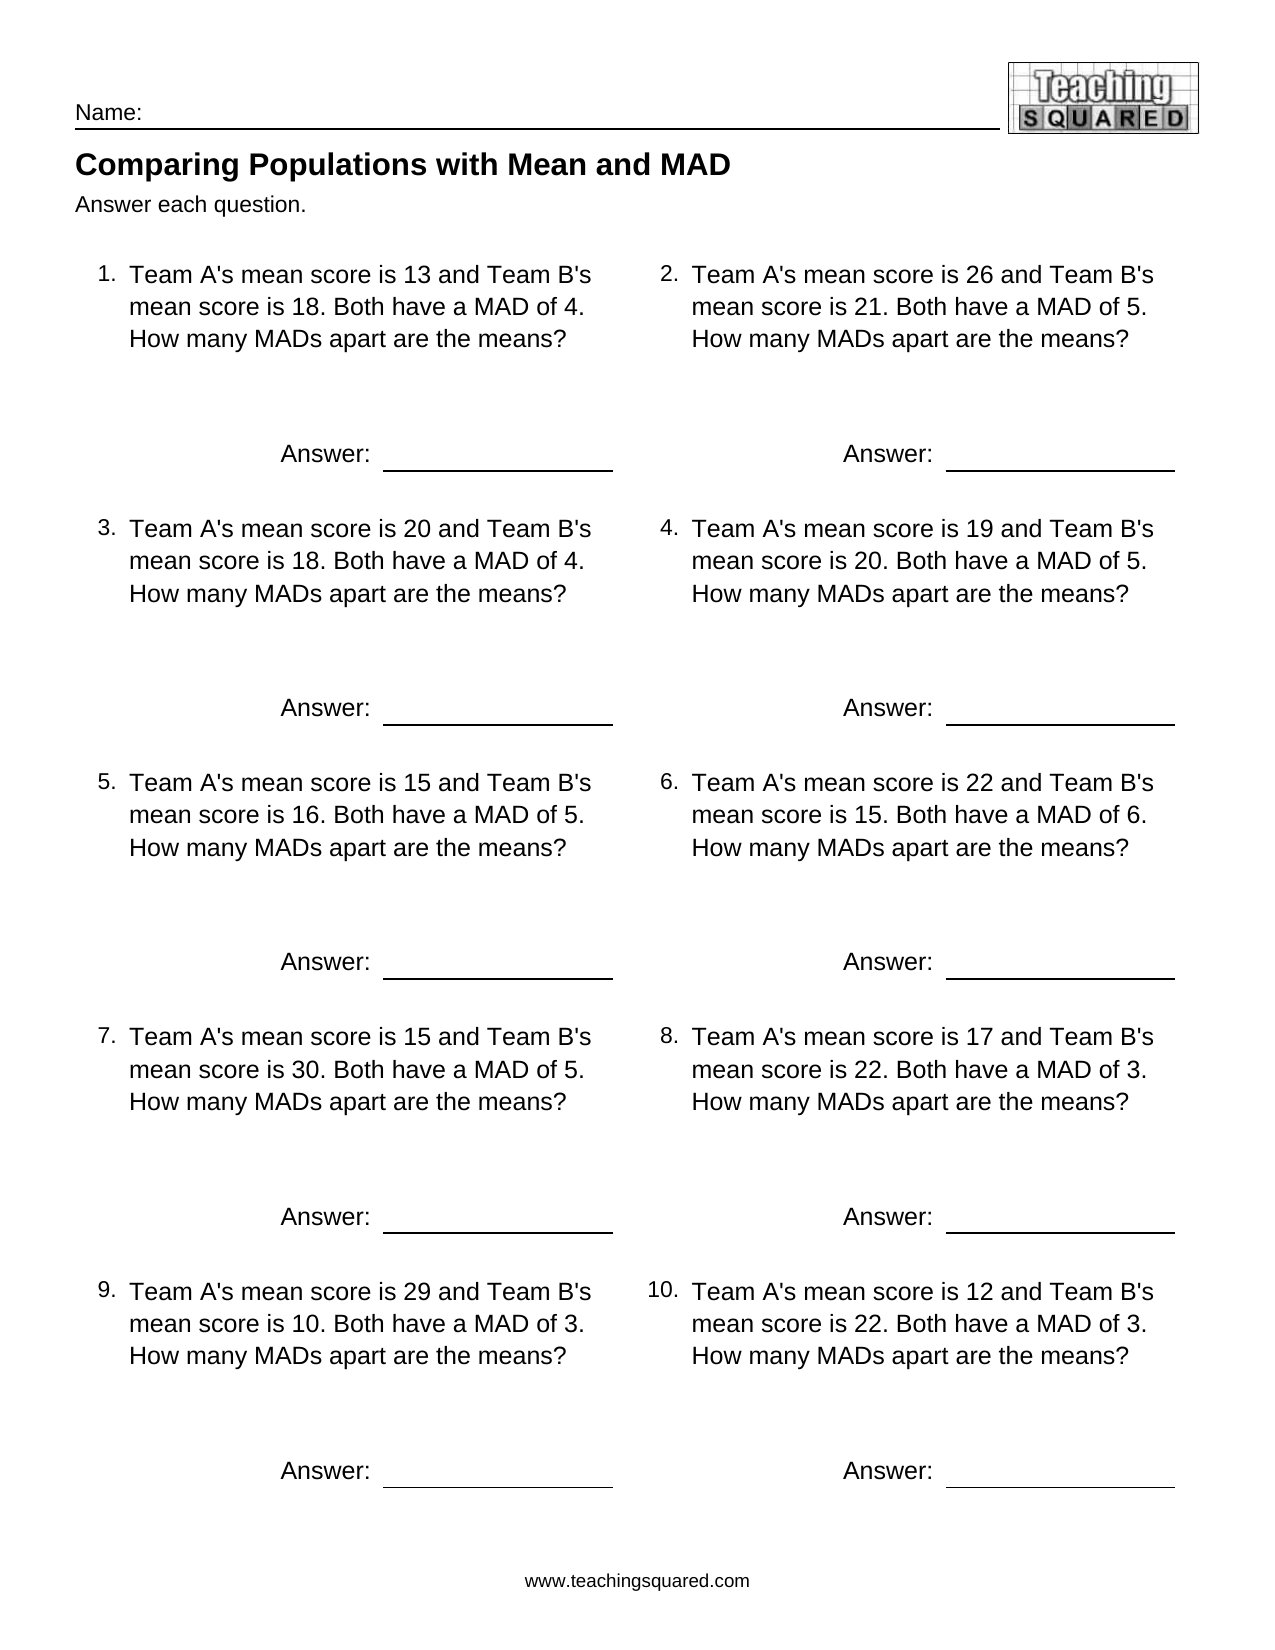 Comparing Populations with Mean and MAD
Use this free 7th grade math worksheet from Teaching Squared. Find more in Statistics and Probability Worksheets and 7th Grade Math Worksheets.